


The PROB function in Excel is useful when you need to calculate for probability in Excel.
This guide will show you how to use the PROB function to calculate how likely an event is to occur. We’ll first set up a table to determine the probability of each event and then create a probability calculator that uses that table.
Probability is the mathematical measurement that calculates how likely an event or set of events would occur in a situation.
For example, the chances of getting a 5 when rolling a dice is 1 in 6, or 16.66%. Probabilities can also be added up. If we wanted to know how likely it is for a dice roll to give us a number greater than 4, then we simply add the probabilities of getting 5 and 6. This would give us a ⅓ chance or 33.33%
Solving for the probability involves a simple arithmetic formula:
P(E) = n(E) / n(S)
This reads as follows: The probability of an event occurring is equal to the number of occurrences of an event divided by the total number of possible outcomes.
Let’s take a look at a quick scenario where we can use the PROB function to calculate probabilities.
We have a list of numeric grades from 0 to 100. We have been supplied the probability of getting each grade in a test. For example, a student has a 20% chance of getting a 70 while they have a 3% chance of getting 100 in the test. Is it possible to determine how likely it is for a student to get at least 60?
The PROB function makes it easier to solve for a range of probabilities. You simply just need to define the lower and upper limit and Excel will automatically solve for the probabilities of getting a result within that range.
There are also several use cases for the PROB function in Excel. It is often used to perform financial probability analysis for risk management and can also be used to estimate losses in a business.
Now that we know when we can calculate the probability in Excel, let’s look into how to start using it.
The Anatomy of the PROB Function
The syntax of the PROB function is as follows:
=PROB(x_range, prob_range, [lower_limit], [upper_limit])
Let’s look at each term to understand what they mean.
- = the equal sign is how we start any function in Excel.
- PROB() is our
PROBfunction. It returns the probability that values in a range are between two limits. - x_range refers to the range of numeric values of x
- prob_range refers to the set of probabilities that are associated with x_range
- lower_limit refers to the lower bound on the value that you are computing probability for.
- upper_limit is the optional upper bound of the value that you are computing the probability for.
A Real Example of Calculating Probability in Excel using the PROB function
Let’s take a look at a real example of the PROB function being used in an actual Excel spreadsheet.
The table below has a list of letter grades from F to A+. We computed the probability each student had of getting a particular letter grade.
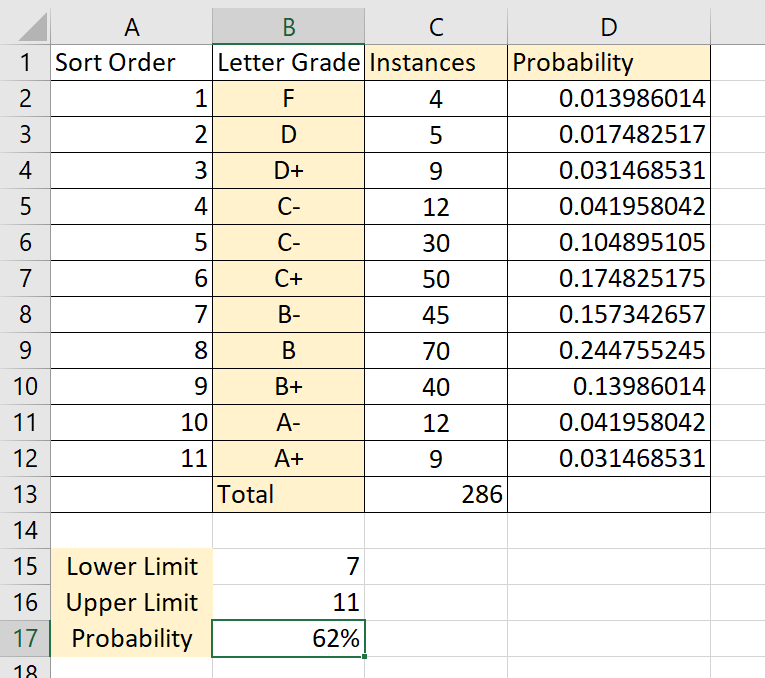
Using the PROB function, we can find out how likely it is for a student to get a B- or higher on this test. We can also refer to the Sort Order column to let the PROB function know which probabilities to add.
To get the result in cell B17, we just need to use the following formula:
=PROB(A2:A12,D2:D12,3)
You can make your own copy of the spreadsheet above using the link attached below.
If you’re ready to try out the PROB function in Excel, let’s start learning how to write it ourselves!
How to Calculate Probability in Excel
This section will guide you through each step needed to start using the PROB function in Excel. You’ll also learn how we can use this function to solve for the probability that an event or range of events will occur.
Follow these steps to start using the PROB function:
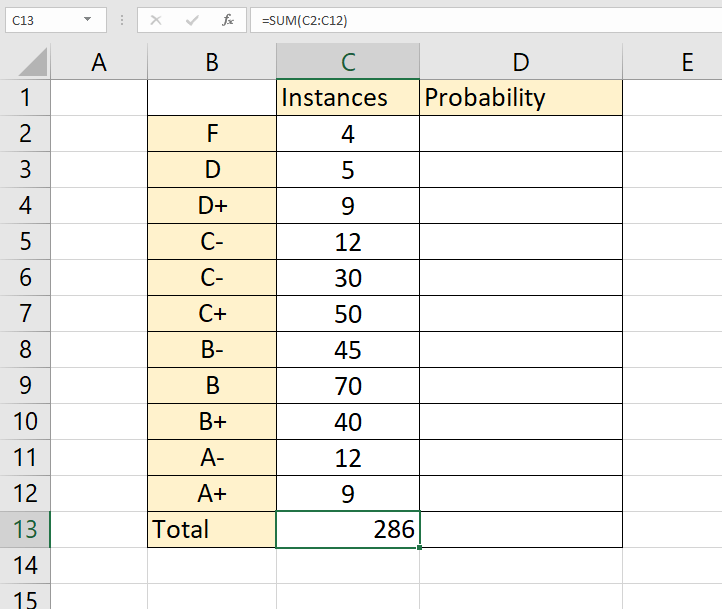
- First, we must solve for the probabilities of each letter grade. We compute the sum of each instance to get the total number of occurrences.
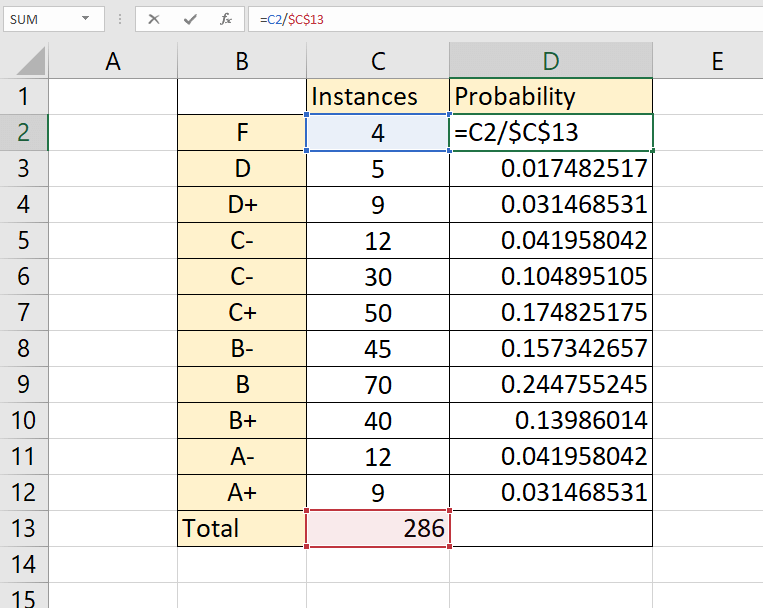
- Next, we divide the number of instances for each letter grade by the total number of occurrences. We do this for each letter grade in our table.
- We’ve added a Sort Order column to help us refer to specific probabilities later. We’ve also given the lower limit and upper limit for the probability we want to compute.
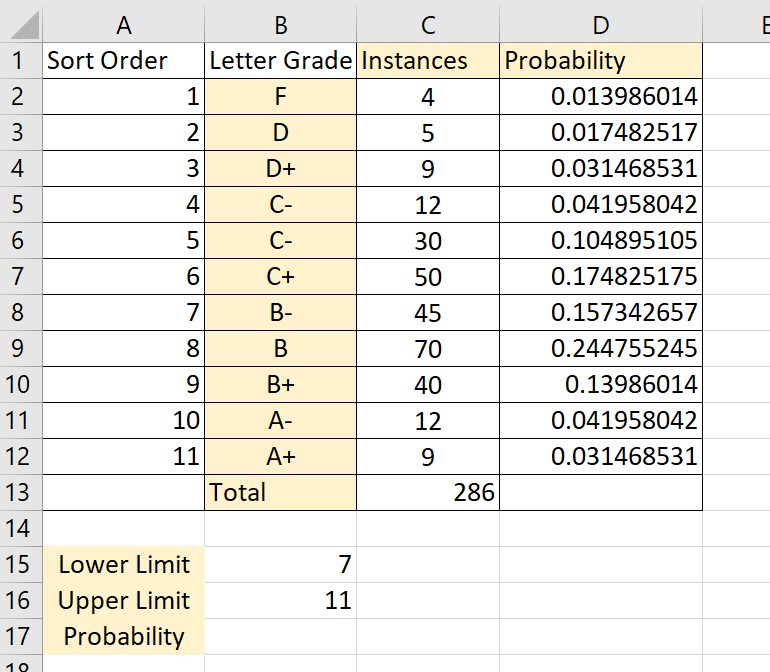
- Next, we will now add arguments to our
PROBfunction. First, we’ll use the Sort Order range as our x_range argument and Column D as our prob_range argument. We’ll use cell B15 and B16 as our lower and upper limits.
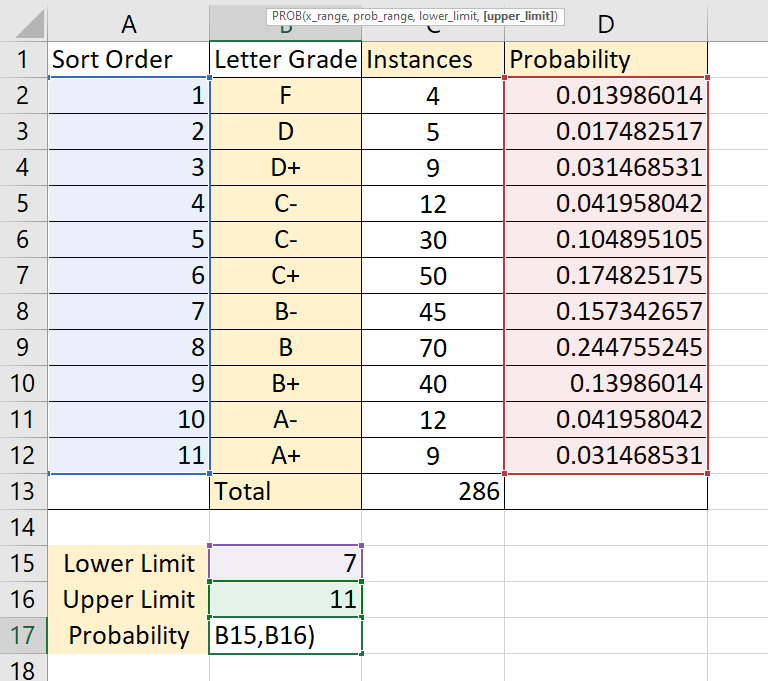
- Hit the Enter key to evaluate the formula. In this example, we have determined that there is a 62% probability that a student will receive a grade of B- or higher in the exam.
Frequently Asked Questions (FAQ)
- Why does my formula return an error?
There may be also several reasons why thePROBfunction returns an error. First, ensure that the sum of values in the prob_range argument is equal to 1. If the sum is not equal to 1,PROBreturns the#NUM!error value. Second, the values in prob_range must not exceed 1 or go lower than zero. - What happens if I don’t supply an upper limit?
If the user does not provide an upper limit, Excel’sPROBfunction will return the probability of x being equal to the lower_limit. In the example below, we’ve supplied 3 (D+) as our lower limit and provided no upper limit. The formula simply gave us the probability of a student receiving a D+.

This is all you need to remember to start using the PROB function to calculate probability in Excel. This step-by-step guide should help you set up spreadsheets that can easily solve for probabilities.
The PROB function is just one example of a statistical function you can easily use in Excel. With so many other Excel functions out there, you can surely find one that best fits your use case.
Are you interested in learning more about what Excel can do? Subscribe to our newsletter for more guides on Microsoft Excel!


