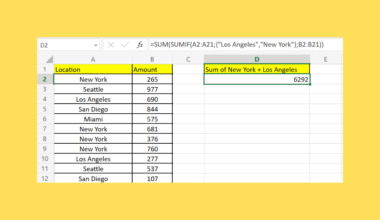
This guide will explain how to create a confusion matrix in Excel.
The confusion matrix is a statistical table that measures the performance of a classification algorithm.
Confusion tables are often used in the field of machine learning, particularly in the context of supervised learning algorithms.
These types of algorithms learn from labeled training data to label new data.
Since these algorithms sometimes return the wrong output, statisticians need a way to measure how often the algorithm makes the wrong classification.
The confusion matrix, also known as an error table, provides a visualization of what types of errors the algorithm makes.
The most straightforward confusion matrix is a 2×2 table where each row represents either a positive or negative label of the actual data point. Each column represents instances of a positive or negative prediction.
We now have four different outcomes for a classification: true positive, false negative, false positive, and true negative.
Let’s take a look at an example of a scenario where we might need to create our own confusion matrix.
Suppose you have tested the performance of an algorithm that detects whether an image has been modified by photo-editing software such as Photoshop.
The algorithm either returns 1 or 0. A value of 1 indicates that the case has an edited photo. After the algorithms have classified each photo, you create a dataset that compares the predicted label with the actual label.
We can use the COUNTIFS function in Excel to create our confusion matrix. Afterwards, we will use a few simple formulas to determine other important metrics, such as the algorithm’s accuracy and precision.
Now that we know when to create a confusion matrix, let’s learn how to use it and work on an actual sample spreadsheet.
A Real Example of a Confusion Matrix in Excel
The following section will look into a real example of a confusion Matrix in Excel. We will also explain the formulas and tools used in these examples.
First, let’s take a closer look at our sample dataset. The table below shows the actual and predicted classifications of the edited and unedited images we described earlier.

Our confusion matrix will tell us how often our algorithm produces an error and whether they produce more false positives or false negatives.

To get the values in cell G3, we just need to use the following formula:
=COUNTIFS(A2:A25,0,B2:B25,0)
The COUNTIFS function allows us to enumerate the number of data points that match a specific set of conditions. For true negatives, we want the values in columns A and B to both be 0. We’ll have to change the second and fourth arguments appropriately to find the rest of the values in our confusion matrix.

After building our confusion matrix, we can use these values to find other helpful metrics.
Recall, also known as sensitivity, refers to the ratio of correct positive predictions to the total positive examples. In other words, a high recall means that most positive cases are labeled correctly.
We can find the algorithm’s recall using the following formula:
=H4/SUM(G4:H4)
Accuracy, on the other hand, refers to the ratio of correctly predicted examples by the total number of examples. A high accuracy means that the algorithms correctly classify most cases.
We can determine the accuracy from our confusion matrix by using this formula:
=SUM(G3,H4)/SUM(G3:H4)
Another metric we can derive from our confusion matrix is precision. The precision of your algorithm is defined as the ratio of correct positive predictions to the total predicted positive cases. High precision means your algorithm likely makes a correct positive prediction.
We can find the precision using the following formula:
=H4/SUM(H3:H4)
An advanced metric you can use to measure the performance of a model is the F1 score. A high F1 score is obtained by finding the harmonic mean of the precision and recall values. A high F1 score ensures that both the recall and precision of a model are taken into account in a single measurement.
We can find the F1 score using the following formula:
= 2 * ((F8*F6)/(F8+F6))
Do you want to take a closer look at our examples? You can make your own copy of the spreadsheet above using the link attached below.
If you’re ready to try setting up your own confusion matrix, head over to the next section to read our step-by-step breakdown on how to do it!
How to Create a Confusion Matrix in Excel
This section will guide you through each step needed to start setting up a confusion matrix in Excel. You’ll learn how to use the COUNTIFS function to fill up the confusion matrix. We will also explain how to derive other metrics, such as accuracy and precision.
- First, create a 2×2 table for your confusion matrix.

- Next, use the
COUNTIFSfunction to determine the number of true negatives. Both the actual and predicted value should equal 0.

- We’ll use
COUNTIFSto find the number of false negatives. These are values that are incorrectly labeled as positive by our algorithm.

- We’ll use the
COUNTIFSagain to find the number of false positives. These are negative cases that the algorithm labeled as positive.

- Finish off the confusion matrix by finding the number of true positives. We’ll use
COUNTIFSto find cases where both the actual and predicted values are equal to 1.
- We can find the recall value by using the formula
=H4/SUM(G4:H4).

- The algorithm’s accuracy can be determined through the formula
=SUM(G3,H4)/SUM(G3:H4).

- Use the formula
=H4/SUM(H3:H4)to find the precision of our classification algorithm.

- We can find the F1 score by using the formula
= 2 * ((F8*F6)/(F8+F6)).
This step-by-step guide should provide you with all the information you need to create a confusion matrix in Excel
The confusion matrix is just one example of the many statistical methods you can set up in your Excel spreadsheets. Our website offers hundreds of other functions and methods to help you get more out of Microsoft Excel.
With so many other Excel functions available, you can find one appropriate for your use case.
Don’t miss out on our team’s new spreadsheet tips, tricks, and best practices. Subscribe to our newsletter to stay updated on the latest guides from us!