This guide will explain how to calculate point estimates in Excel.
The point estimate can refer to several types of statistics that estimate some parameters in a population.
We can define a point estimate as an estimation applied to a set of sample data.
For example, the sample mean of a population is a point estimate of the population mean. Similarly, the sample variance is a point estimate of the population variance.
Let’s take a look at a quick example of a situation where you may need to find the point estimates of a population.
Suppose you want to know the average weight of a certain product manufactured by an assembly line. Since thousands of units are created daily, it is impractical to precisely measure each product.
The solution is to measure a smaller sample of the output rather than the entire population. After weighing a random sample of 100 units, we can now compute point estimates for that population.
Excel includes several built-in statistical functions that we can use to calculate point estimates. For example, we can use AVERAGE to find the sample mean and ST.DEV to find the sample standard deviation.
Now that we know when to calculate point estimates in Excel, let’s learn how to compute these values on an actual sample spreadsheet.
A Real Example of Calculating Point Estimates in Excel
The following section provides several examples of how to use this function. We will also explain the formulas and tools used in these examples.
First, let’s take a look at our sample data.
We have a sample of 33 height measurements from a certain population. Each height is measured in centimeters and has been selected randomly from the overall population.

We can use existing Excel function to find common point estimates such as sample variance, sample mean, and sample standard deviation.
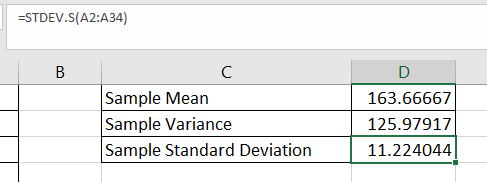
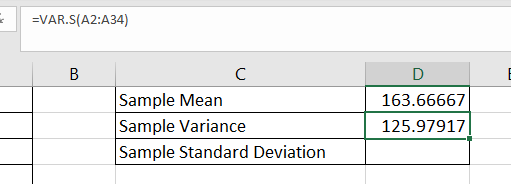
To get the values in Column D, we just need to use the following formulas:
=AVERAGE(A2:A34)
=VAR.S(A2:A34)
=STDEV.S(A2:A34)
The latter two formulas include a “.S” to differentiate them from their “.P” variants. The “S” variations are best used when calculating statistics from sample data.
Do you want to take a closer look at our examples? You can make your own copy of the spreadsheet above using the link attached below.
If you’re ready to try calculating point estimates in Excel, head over to the next section to read our step-by-step breakdown on how to do it!
How to Calculate Point Estimates in Excel
This section will guide you through each step needed to calculate point estimates in Excel. You’ll learn how to use AVERAGE, VAR.S, and STDEV.S with sample data to compute point estimates of a population.
Follow these steps to start calculating point estimates in Excel:
- First, we’ll use the
AVERAGEfunction to find the sample mean.
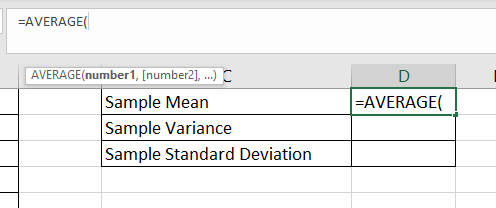
- Add the cell range as the argument of the
AVERAGEfunction. Hit the Enter key to evaluate the function.

- Next, we’ll find the sample variance using an Excel function. We’ll use the
VAR.Sfunction to compute the level of dispersion based on our sample data.

- Type the cell range of the sample data as an argument. Hit the Enter key to evaluate the
VAR.Sfunction.
- The last point estimate we’ll compute is the sample standard deviation. We can find this statistic using the
STDEV.SExcel function.

- After typing the sample cell range, hit the Enter key to evaluate the function.
These are all the steps needed to calculate point estimates in Excel.
Frequently Asked Questions (FAQ)
Here are some frequently asked questions about calculating point estimates in Excel:
- What is the difference between point estimates and interval estimates?
Interval estimates refer to a range of values for a statistic. These intervals are often paired with a confidence level that determines how certain it is that the actual statistic lies within the stated range. For example, you may have a 90% certainty that the average height of the population is between 150cm and 180cm.
Point estimates, in contrast, refer to an exact value. For example, you may declare that the sample mean height of a population is 165cm. - What is the drawback to using only point estimates.?
The main drawback of point estimates is that they often lack information on how reliable the statistic is. While a point estimate is simpler to understand, it may be more beneficial to describe a statistic with an interval. The interval will be more likely to contain the population parameter being estimated.
This step-by-step guide should provide you with all the information you need to calculate point estimates in Excel.
You should now understand the strengths and limitations of point estimates for understanding your population. You should also now be able to find basic point estimates such as the sample mean, sample variance, and sample standard deviation.
Finding point estimates is just one example of the many statistical methods you can perform in Excel spreadsheets. Our website offers hundreds of other functions and methods to help you get more out of Microsoft Excel.
With so many other Excel functions available, you can find one appropriate for your use case.
Don’t miss out on our team’s new spreadsheet tips, tricks, and best practices. Subscribe to our newsletter to stay updated on the latest guides from us!