This guide will explain how to generate an ANOVA analysis for a randomized block design experiment in Excel.
The ANOVA table will help the researcher determine whether there is a significant difference between two or more groups.
The randomized block design is a type of experimental design where similar experimental units are grouped into locks. The goal of blocking is to create groupings where the dependent variable is more similar within blocks than across blocks.
Using a randomized block design with an effective blocking variable can provide more precision than other types of experimental designs.
The randomized block design can be used with the analysis of variance or ANOVA table.
Let’s take a look at a quick example where we can use a Randomized Block Design.
Suppose we want to test the effectiveness of three different teaching methods. We want to determine whether the type of teaching method used affects a student’s performance on a certain test.
After obtaining all the test scores, we will have to group the students into separate blocks. For example, we can try to group the students by their IQ. This means that all students within a certain block have the same IQ.
Within each block, each student will be assigned a teaching method at random.
Now that we have our data, how can we output the ANOVA table using randomized block analysis?
Excel includes an add-in known as the Analysis Toolpak. The add-in will allow us to output a Two-Factor ANOVA table without replication.
After the tool outputs our ANOVA table, we can take a closer look at the critical values to determine whether there is a significant difference among each tested teaching method.
Now that we know when to use an ANOVA table and a randomized block design, let’s take a look at an actual spreadsheet.
A Real Example of Using ANOVA for a Randomized Block Design in Excel
The following section provides several examples of how to use this function. We will also go into detail about the formulas and tools used in these examples.
First, let’s take a look at the dataset we’ll be analyzing. The table below contains our test data grouped together into multiple blocks.
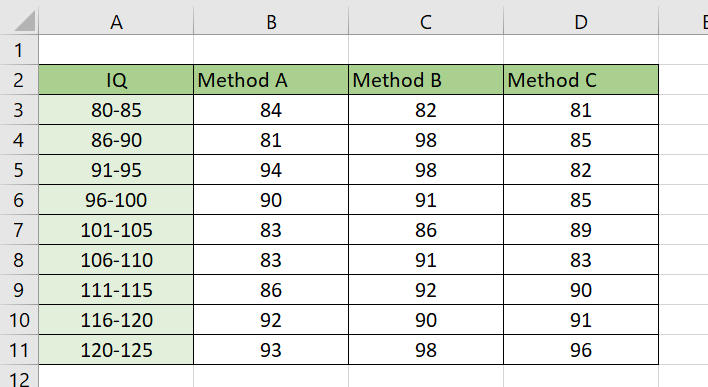
For each IQ blocking, we’ll select three students that fall within the range of that block. Afterward, we’ll assign each student a random teaching method.
For example, a certain student with an IQ of 112 would be sorted in row 9 of our spreadsheet. When we assigned them with the teaching method A, they later received a score of 86. Meanwhile, a student with an IQ of 113 got a score of 92 after taking method B.
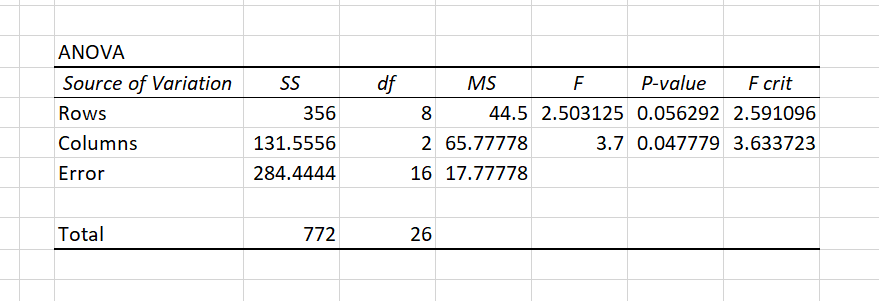
Now that we have our groupings, we’ll use the Analysis Toolpak to generate an ANOVA table to determine if the teaching method has any effect on the scores.
The generated table shows that the P-value for ‘Columns’ is 0.04. Since this value is smaller than the significance level of 0.05, we can conclude that the teaching method has a statistically significant effect on the test score.
Do you want to take a closer look at our examples? You can make your own copy of the spreadsheet above using the link attached below.
If you’re ready to try generating an ANOVA table for a randomized block experiment, read our next section to follow our step-by-step breakdown on how to do it!
How to Perform a Randomized Block Design ANOVA in Excel
This section will guide you through each step needed to perform a randomized block design ANOVA test. You’ll learn how to activate the Analysis Toolpak add-in and how to use it to generate an ANOVA table.
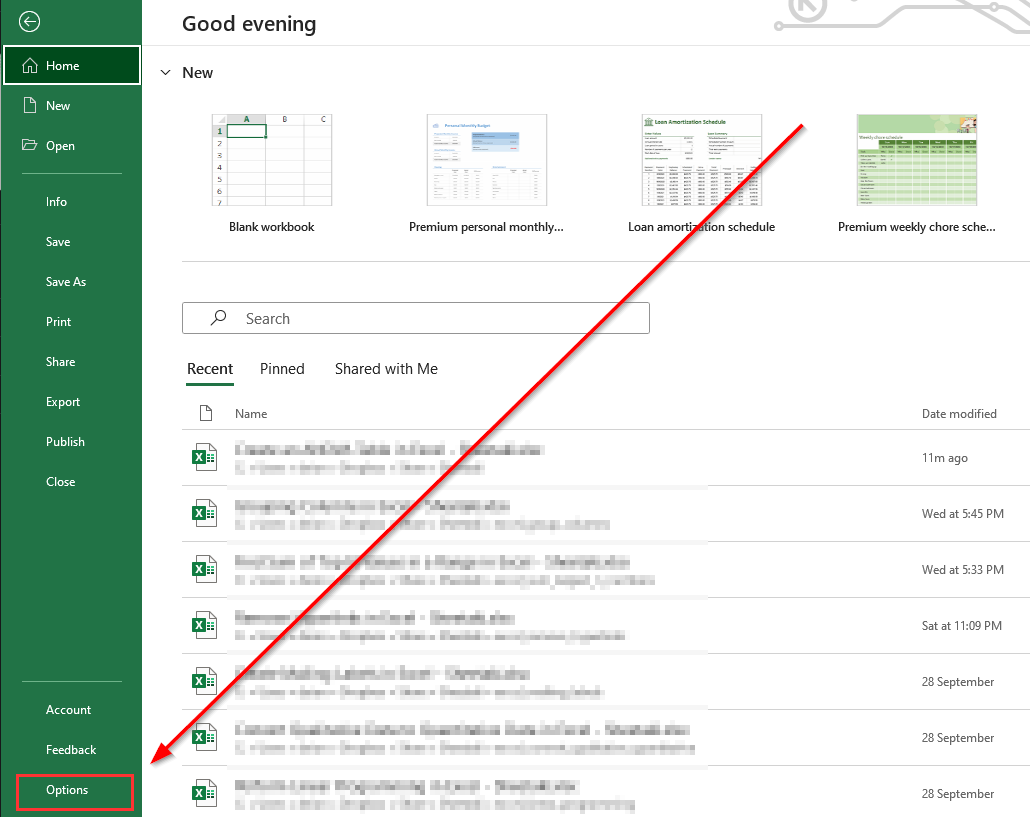
- First, we’ll have to enable the Analysis Toolpak add-in in our sheet. Click on the File tab to access the Excel Options menu.

- Click the Options button in the screen’s bottom-left corner.
- In the Excel Options dialog box, click the Add-ins tab and select the Go button.
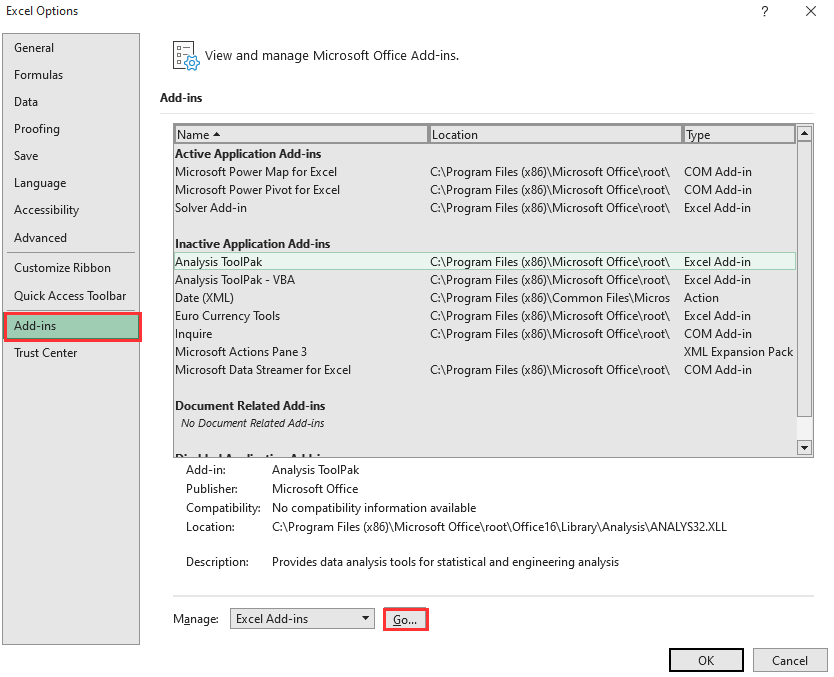
- Check the Analysis Toolpak option in the list of available add-ins. Click on OK.

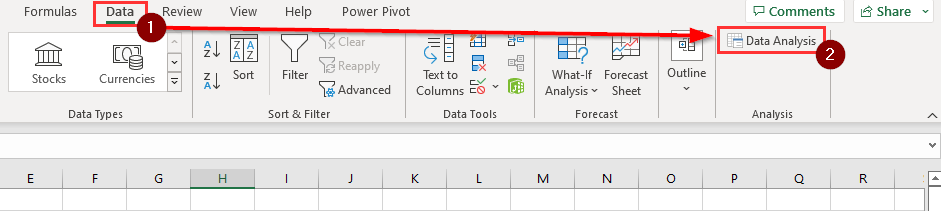
- You’ll now be able to find the Data Analysis option in the Data tab. Click on this option to create an ANOVA table in your worksheet.
- In the Data Analysis dialog box, select the Anova: Two-Factor Without Replication option. Click on OK.

- Specify the input range containing the variable data. Indicate whether the input range includes labels. Next, specify the alpha for the analysis. We’ll use the standard value of 0.05 as our alpha or threshold for significance.
 We’ll also have to indicate the output range. In our example, we’ll output the ANOVA table in cell F2.
 - The ANOVA table should now have the statistical values you need to conclude whether to reject the null hypothesis or not.
These are all the steps needed to create an ANOVA table for your randomized block design results.
This step-by-step guide should provide you with all the information you need to start creating an ANOVA table with a dataset following a randomized block design.
You should also be able to read the ANOVA table and understand how to interpret the results.
The Analysis Toolpak is just one example of the many Excel tools you can use in your spreadsheets. Our website also offers hundreds of other functions and methods to help you get more out of Microsoft Excel.
With so many other Excel functions available, you can find one appropriate for your use case.
Don’t miss out on our team’s new spreadsheet tips, tricks, and best practices. Subscribe to our newsletter to stay updated on the latest guides from us!