


This guide will explain how to use the XIRR function in Excel
Table of Contents
In finance, the internal rate of return (IRR) is a metric used to measure the average return on an investment. In Excel, we can use the IRR function to find the internal rate of return for investments with regular cash flows.
However, IRR assumes that the cash flows occur regularly, which may lead to inaccurate metrics. For investments with irregular intervals, the best method to use is the extended rate of return or XIRR.
In this guide, we will provide a step-by-step tutorial on how to use the XIRR function in Excel. We’ll cover how to set up a table containing our cash flows and how to return the extended internal rate of return of the investment.
The Anatomy of the XIRR Function
The syntax of the XIRR function is as follows:
=XIRR(values, dates, [guess])
Let’s look at each argument to understand how to use the XIRR function.
- XIRR() refers to our
XIRRfunction. This function returns the internal rate of return for a schedule of cash flows that are not paid periodically. - The values argument must be a series of cash flows. The series of values must contain at least one positive and one negative number.
- The dates parameter must be a given schedule of payment dates that correspond to the cash flow payments from the values parameter.
- guess is an optional number that you guess is close to the final result.
A Real Example of Using the XIRR Function in Excel
Let’s look into how we can use the XIRR function to find the internal rate of return for a series of sample cash flows.

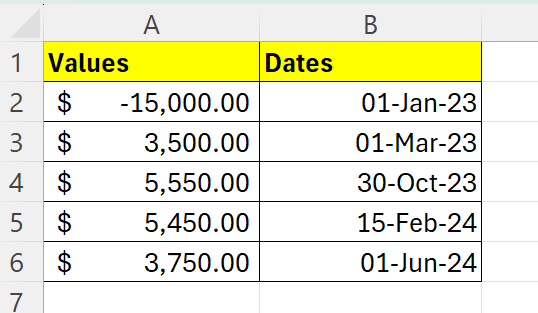
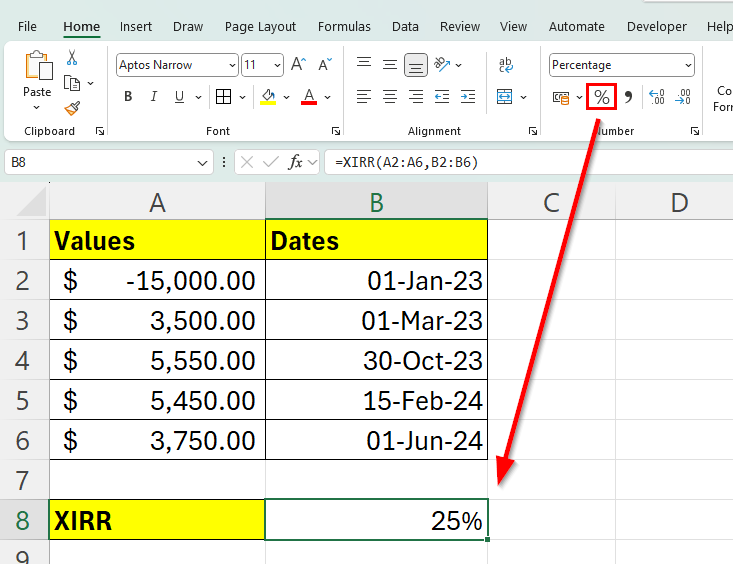
In the table above, we’ve set up our list of cash flows and their corresponding dates. Our table indicates that we’ve invested an initial amount of $15,000 and have been receiving varying amounts every few months after.
We can use the following formula to calculate the XIRR value of the given investment:
=XIRR(A2:A6,B2:B6)
The formula above takes the range containing positive and negative cash flows as the first argument and uses the corresponding range of dates as the second argument. Since we have not provided a guess input, the formula uses the value 0.1 as the guess value.

After evaluating the formula, we’ve determined that our investment has an extended rate of return of about 0.247 or 24.7%.
Click on the link below to create your own copy of our examples.
Head to the next section to read our step-by-step tutorial on how to calculate XIRR in Excel.
How to Use the XIRR Function in Excel
- To easily calculate the internal rate of return, we can create a simple table that keeps track of the cash flow amounts and the corresponding dates.
In the table above, we have a total of five cash flows and the date they occurred. - Next, select an empty cell and type “=XIRR(“ to start the
XIRRfunction.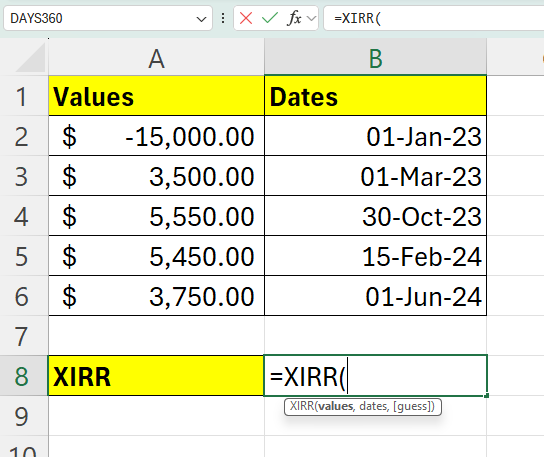
- For the values argument, select the cash flow amounts from the table set up earlier.

In this example, we’ll select the cell range A2:A6. - Next, enter the corresponding date range as the second argument.
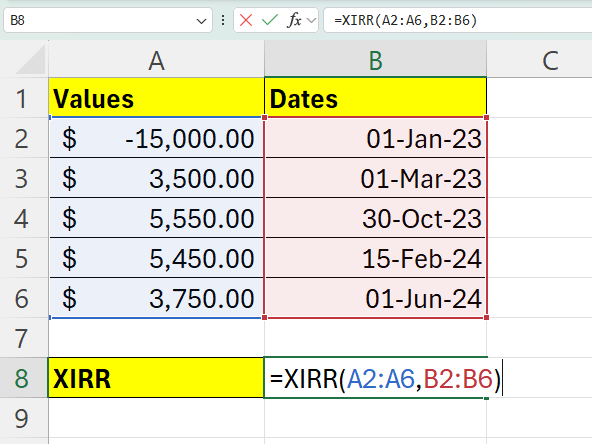
We’ll complete the formula by adding a closing parenthesis. - Hit the Enter key to evaluate the function.
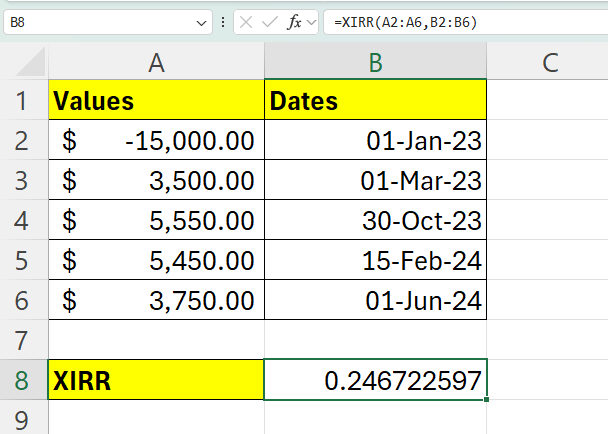
- We can use the Percentage format shortcut in the toolbar to convert the decimal value to a percentage value.
These are all the steps you need to follow to start using the XIRR function in Excel.
FAQs
- Why does my XIRR function return an error?
There are a few possible reasons why XIRR returns an error. You may receive a #NUM! error if your values argument does not contain at least one positive and one negative cash flow value. The #NUM! error may also appear if the values and dates contain different numbers of values.
In some cases, the XIRR function will return an error if it fails to converge. This may occur if the cash flows are highly irregular or if the initial guess provided is significantly far from the actual IRR value. - How does changing the initial guess affect the XIRR calculation in Excel?
While Excel has a default guess of 10%, providing a different initial guess can help the function converge on an accurate rate of return more efficiently, especially in cases where the cash flow pattern is complex. If the default guess leads to errors or non-convergence, trying a different initial guess closer to the expected rate of return might yield better results.
To learn more about using Excel for keeping track of cash flows, you can read our post on how to forecast cash flow in Excel.
That’s all for this guide! Be sure to check out our library of spreadsheet resources, tips, and tricks!


