


This guide will explain how to analyze demographic data in Excel.
Since demographic data comprises many metrics, it is often useful to display additional information to make it easier to understand the overall trends of a population.
Demographic data is statistical data that has been collected to describe the characteristics of a population. The metrics often found in demographic data including age, gender, ethnicity, and income.
Other metrics such as fertility rate and death rate are also common. These metrics are a major determinant of the population growth rate and can help policy-makers plan for the future population.
Besides its application in health and policy-making, demographic data is also useful in market research. Demographic segmentation is an increasingly common activity in businesses that tries to understand the makeup of their audience.
Demographic data can help businesses decide where to launch their next location. Businesses can use demographic information to create a new product targeting a particular audience segment.
Given demographic data in an Excel sheet, we can analyze the data further by creating new fields, using statistical functions, and generating PivotTables.
We’ll explain how to use all of these methods and more in the upcoming sections.
A Real Example of Analyzing Demographic Data
The following section provides several examples of how to analyze demographic data. We will also go into detail about the formulas and tools used in these examples.
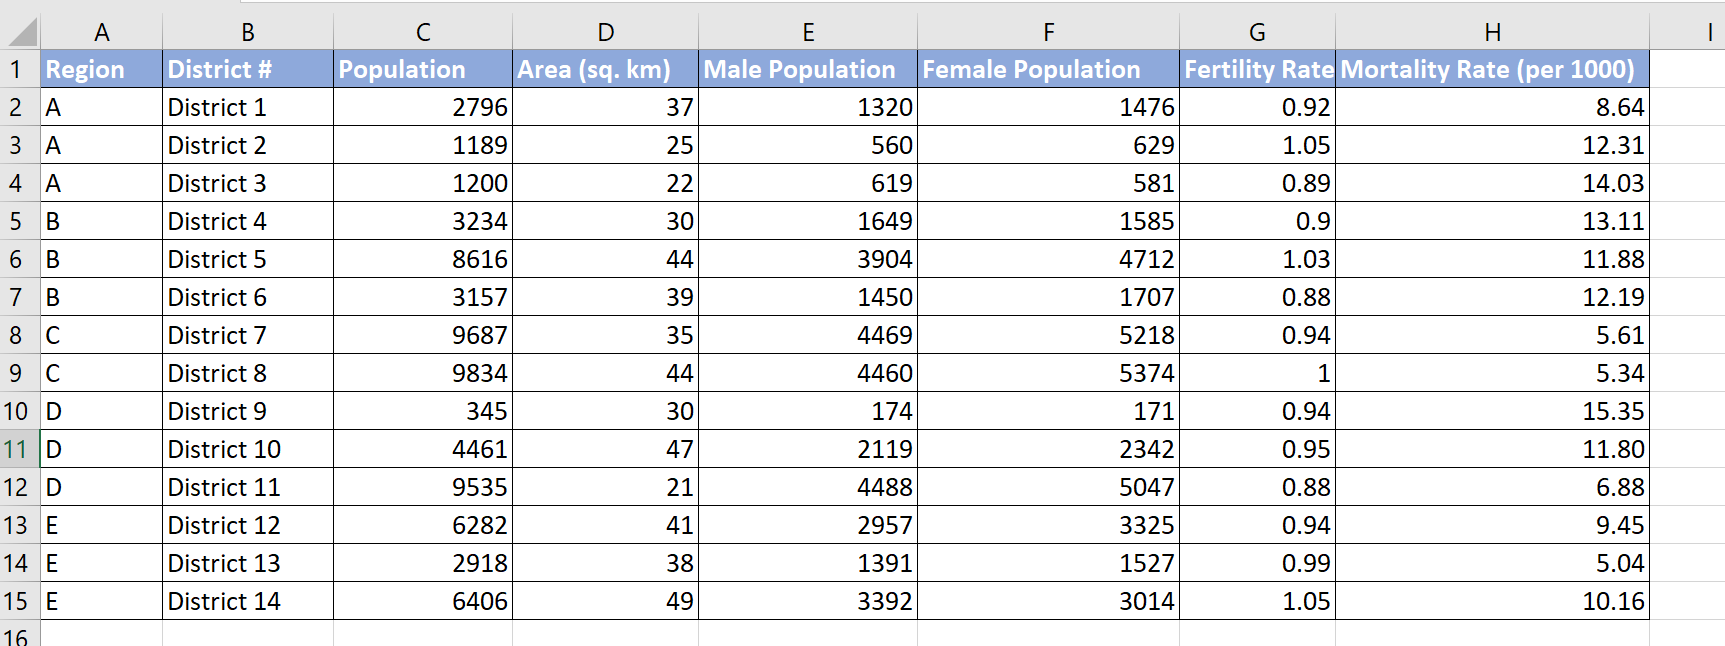
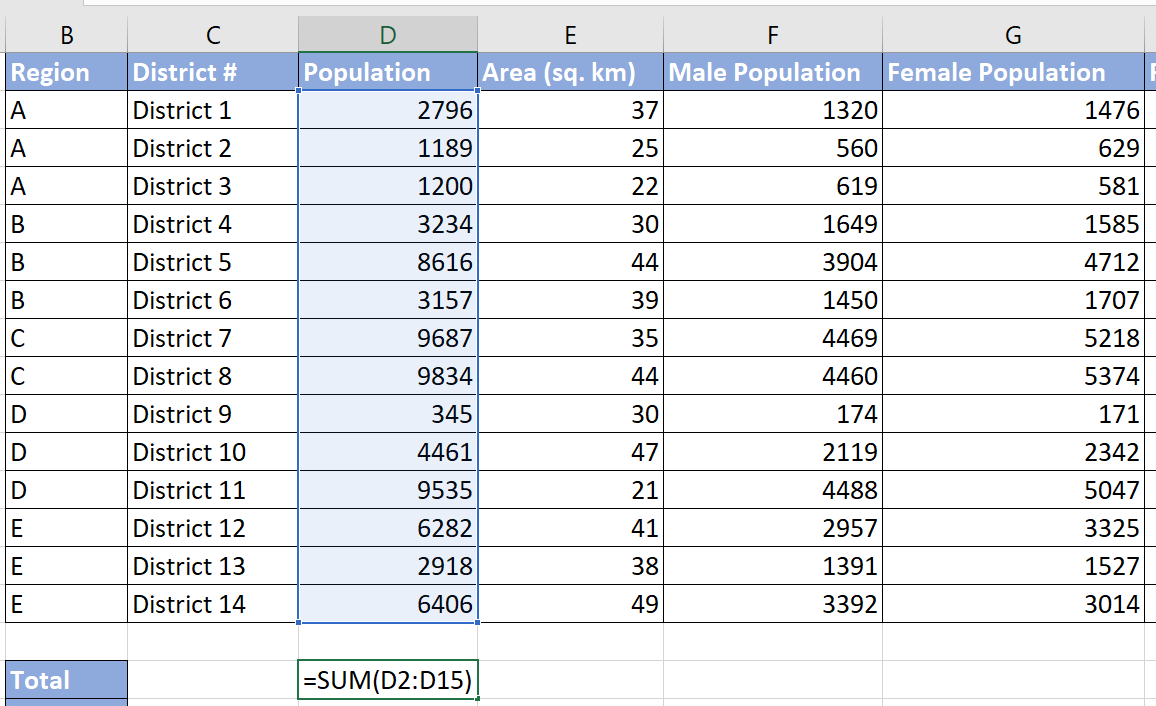
First, let’s take a look at our sample demographic data.
Our sample data provides various demographical information at a district level. Each district belongs to one of five regions.
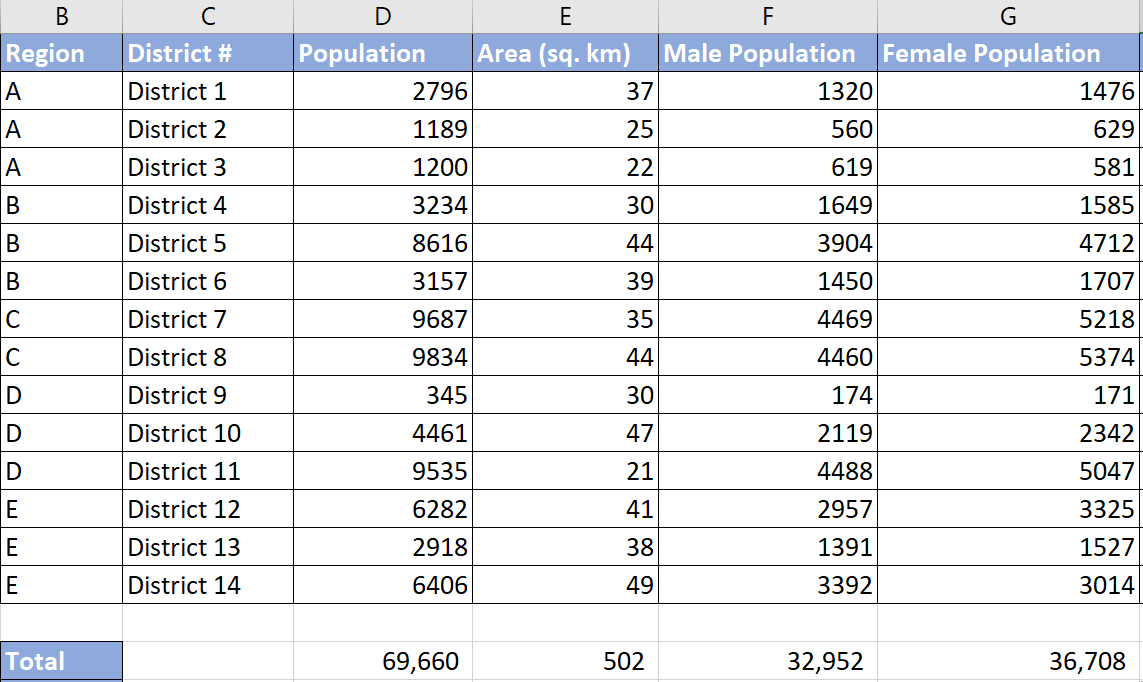
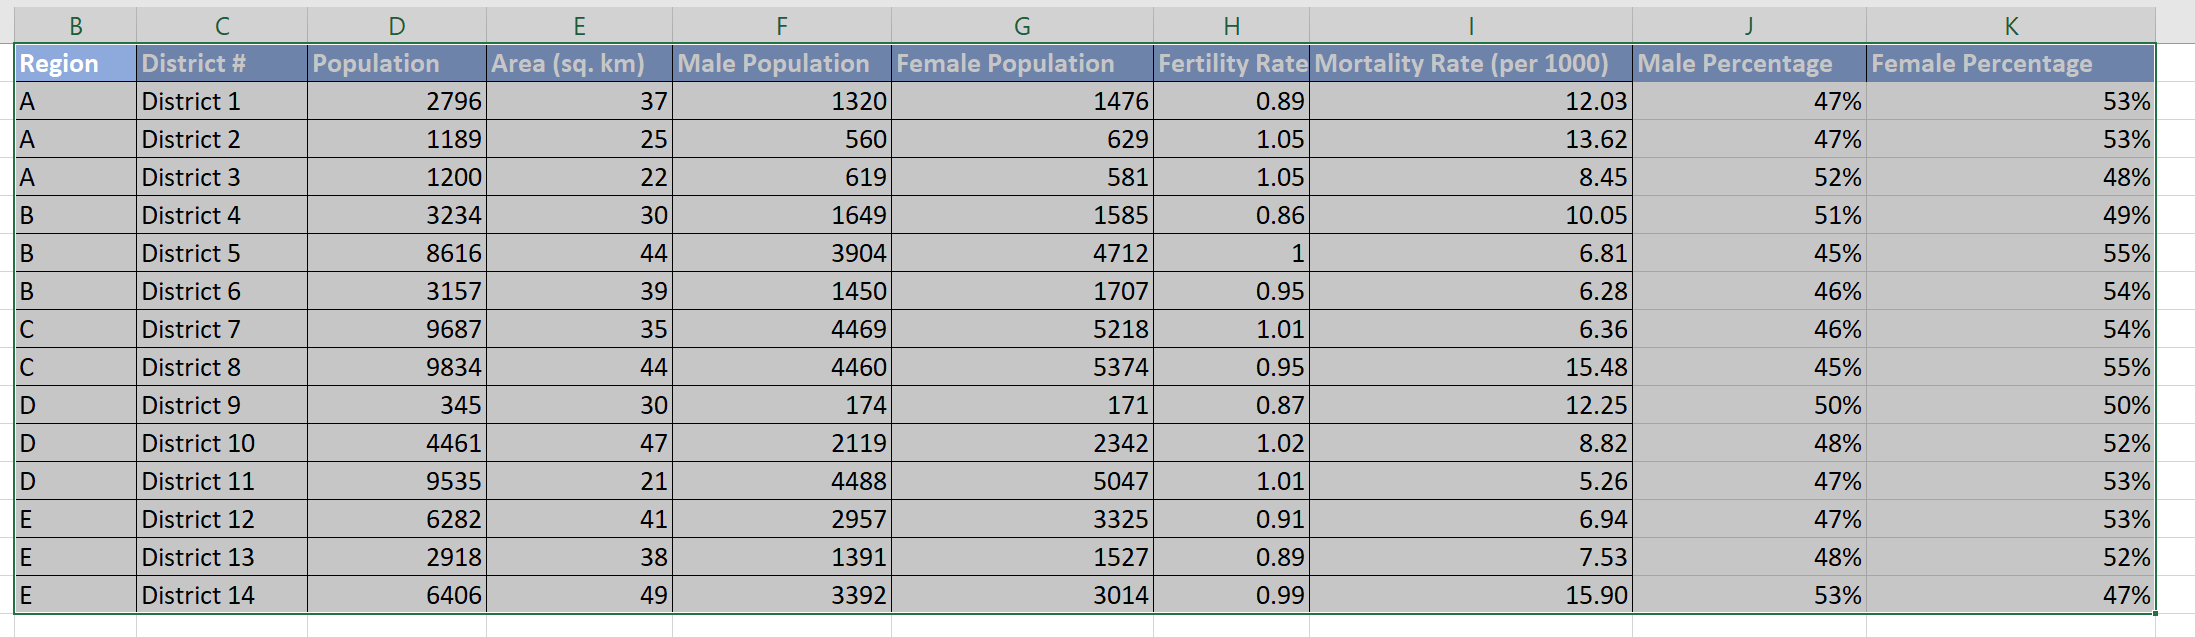
We can expand on the initial dataset by adding new columns. For example, we’ve added fields that compare the male and female percentages within each district. We’ve also used the SUM and AVERAGE functions to provide a summary of different metrics.

Suppose you want to look at these metrics on a regional level. We can create a PivotTable to create a summary of our demographic data for each region.

Do you want to take a closer look at our examples? You can make your own copy of the spreadsheet above using the link attached below.
If you’re ready to analyze your own demographic data in Excel, head over to the next section and read our step-by-step guide on how to start.
How to Analyze Demographic Data in Excel
This section will serve as your guide for analyzing demographic data in Microsoft Excel. You’ll learn how we can derive new fields from existing data. We’ll also show you how to use other Excel functions to create aggregate values, such as the sum or mean of a certain metric.
Lastly, we’ll briefly explain how to set up a PivotTable to analyze your demographic data even further.
Follow these steps to start analyzing your demographic data:
- First, let’s add a new field to our demographic data. Our current dataset contains the breakdown of the male and female population per district. We can use the total population and the gender breakdown to find the percentage of males and females.
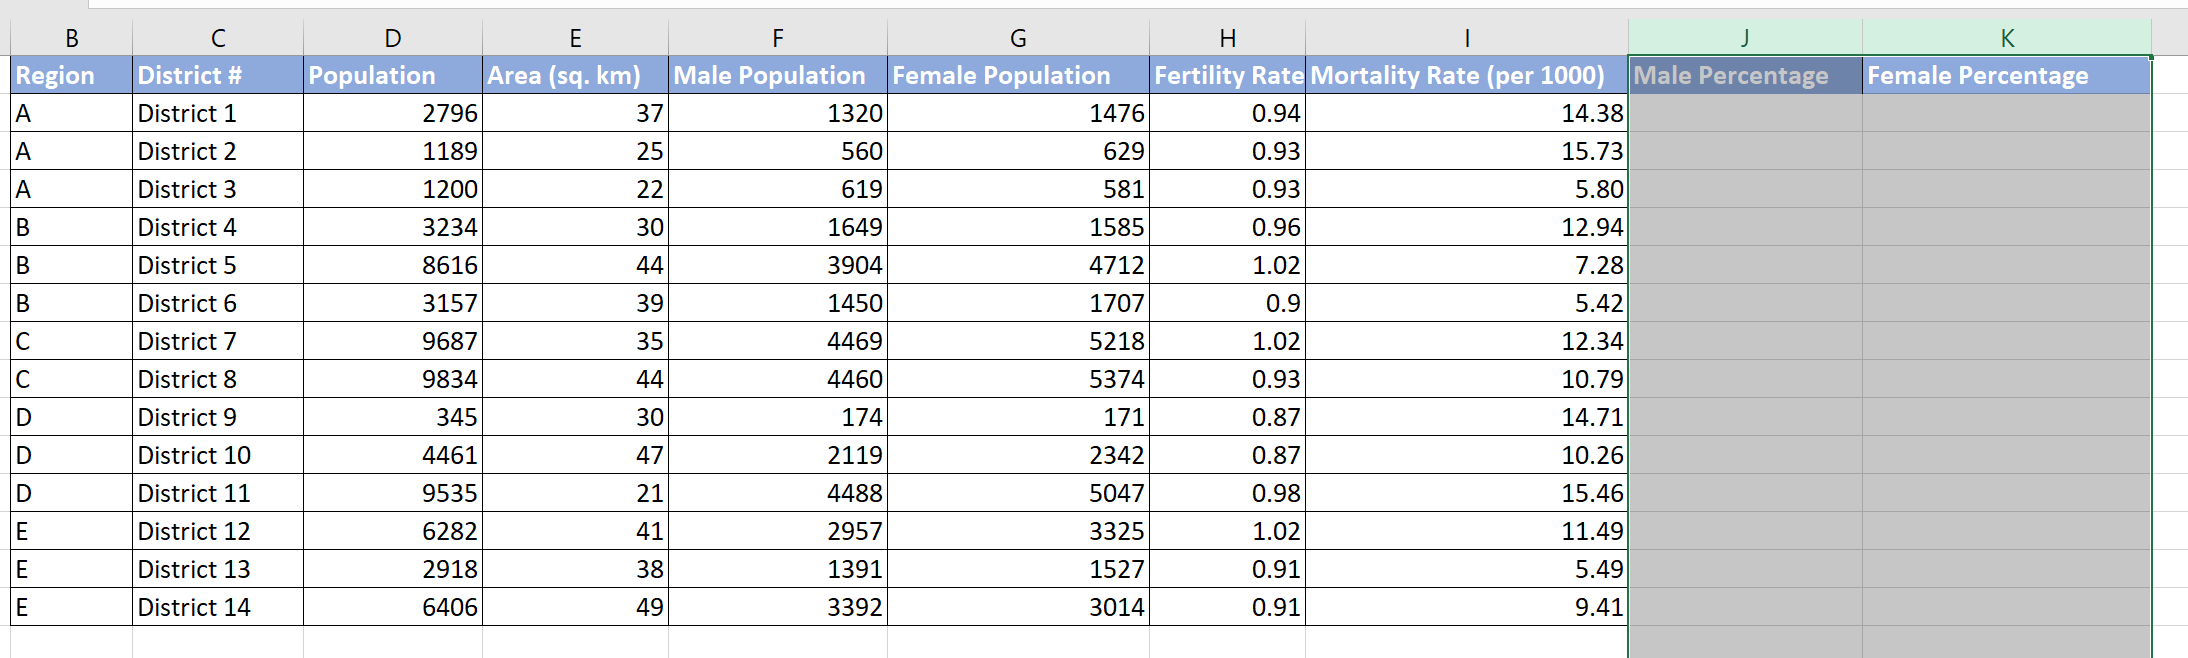
We’ll create two new columns where we will place our new values. - To get the percentage of males in the population, we’ll divide the male population count by the overall district population. Hit the Enter key to evaluate the formula.
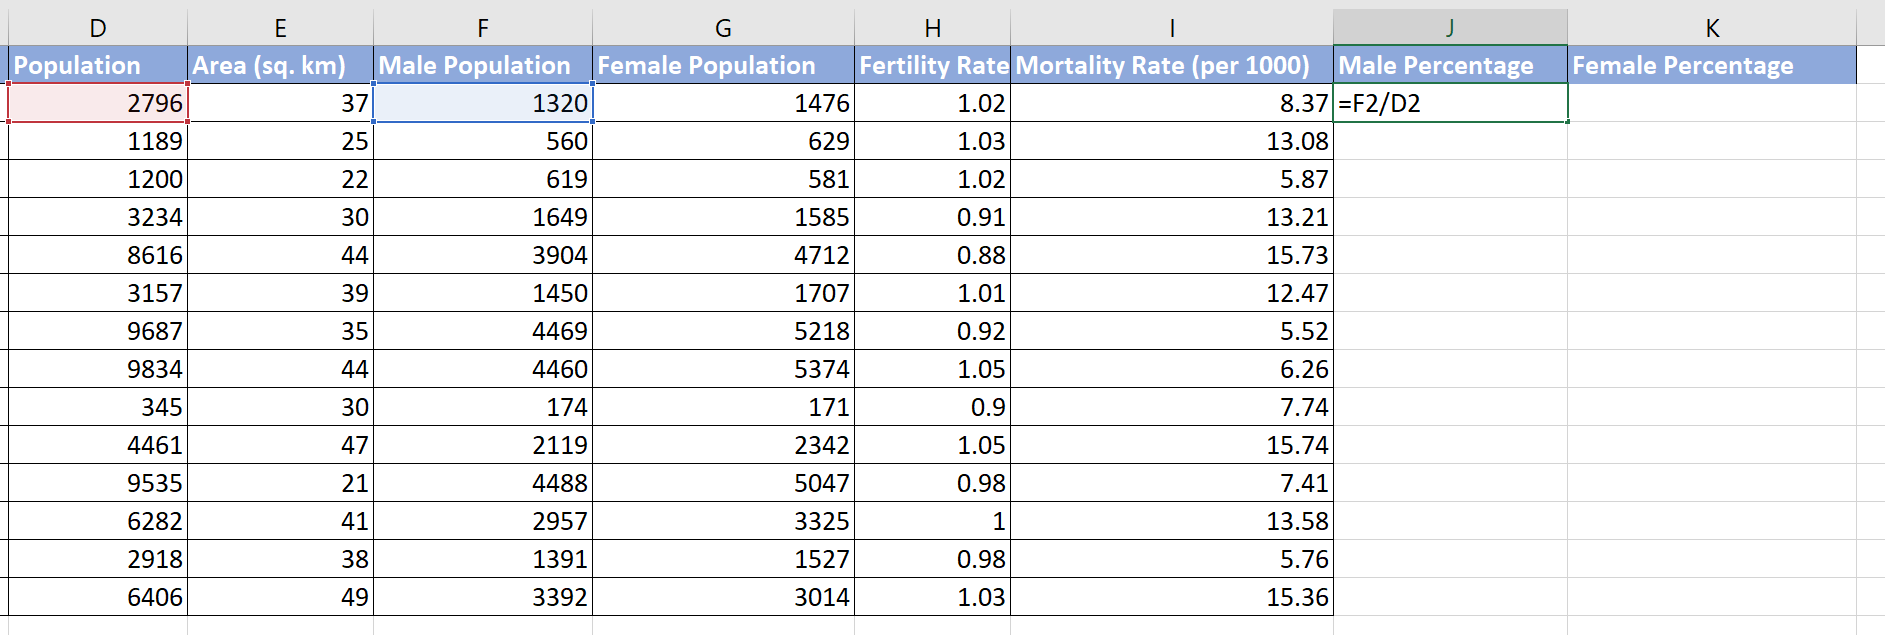
- Use the Fill Handle tool to fill out the rest of the column.
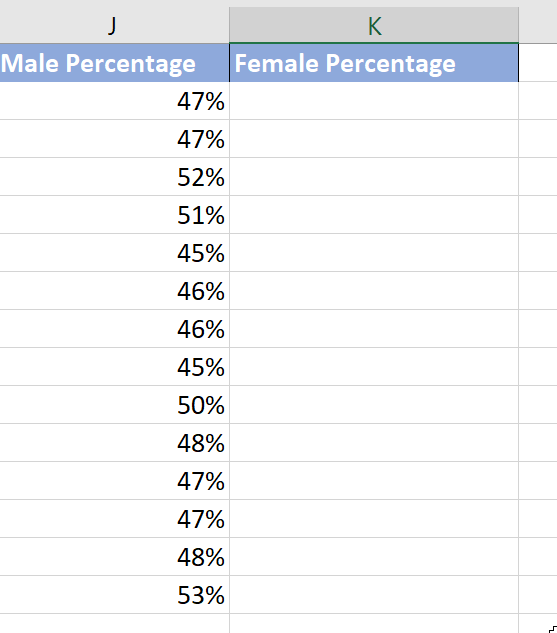
- We’ll repeat the previous steps to get the percentage of the female population.

- Next, we’ll use Excel functions to find aggregate values for certain fields. In this example, we will look for the total and average of several metrics.

- We’ll use the
SUMfunction to return the total population.
- Use the Fill Handle tool to get the sum of other metrics, such as the total area.
- We can use the
AVERAGEfunction to determine the average value for other metrics such as fertility and mortality rates.
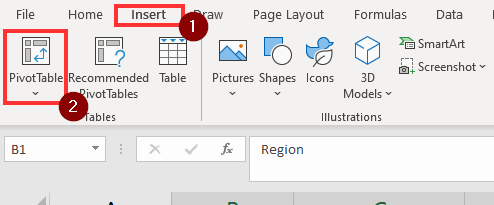
- We can also use the PivotTable tool to conduct a more in-depth analysis of your demographic data. First, select the entire range that contains your data.
- Next, head to the Insert tab and click on the PivotTable option.
- A dialog box will appear, asking the user to select where they want the PivotTable to be placed. In this case, we will add the PivotTable to a new worksheet.

- You will see a PivotTable Fields panel on the right-hand side of your application. The user may drag the desired fields to any of the four areas seen below. In this example, we’ll use the PivotTable to show metrics such as population, fertility rate, and mortality rate on a regional level.

- Your PivotTable should reflect the values you’ve chosen to display in the PivotTable Field panel.
This step-by-step guide is a quick introduction to several techniques you can use to analyze demographic data in Excel further.
You should now be able to use Excel functions and tools such as the PivotTable to find trends in your demographic data.
This function is just one example of the many Excel functions you can use in your spreadsheets. Our website offers hundreds of other functions and methods to help you get more out of Microsoft Excel.
With so many other Excel functions available, you can find one appropriate for your use case.
Don’t miss out on our team’s new spreadsheet tips, tricks, and best practices. Subscribe to our newsletter to stay updated on the latest guides from us!


