This guide will explain how to calculate year-over-year growth in Excel using four easy and simple methods.
Excel is an excellent tool for different tasks, such as calculating and organizing data. Because of the many tools and functions Excel has, it can make performing specific tasks very simple and easy.
And one of which we can do in Excel is calculating the year-over-year growth. So year-over-year growth is used to measure the change in an annualized metric across two comparable periods. And these two periods are usually the current period and the prior period as of the fiscal year-end date.
Luckily, Excel makes this entire process of calculating the year-over-year growth easy and simple.
Let’s take a sample scenario wherein we need to calculate the year-over-year growth in Excel.
Suppose you are creating a financial report for your company for the years 2018 to 2022. And you are tasked to calculate the year-over-year growth to determine the changes and performance of the company over the years. To make your work easier, you opted to perform the calculations in Excel.
Great! Now let’s discuss how to calculate year-over-year growth in Excel using four easy and simple ways.
How to Calculate Year-Over-Year Growth in Excel Using the Basic Formula
Firstly, we can simply calculate the year-over-year growth in Excel using the conventional way of performing the formula. So we would have an initial data set containing the years and the total revenue of each year. And those are the two components we need to calculate the year-over-year growth in Excel.
So the formula for the year-over-year growth is =(new value - old value)/ old value. Additionally, this formula can be used to calculate any kind of percentage change or to determine any change rate.
To calculate the year-over-year growth in Excel using the formula, we can simply follow the steps below:
1. Firstly, we need to create a new column to input the results. Since there is no value before the first year, we cannot calculate its year-over-year growth. So we will calculate starting from the second year inputted.
Then, we can start the formula in cell D8 with an equal sign. So simply input the formula “=(C8-C7)/C7”. Lastly, press the Enter key to return the result.
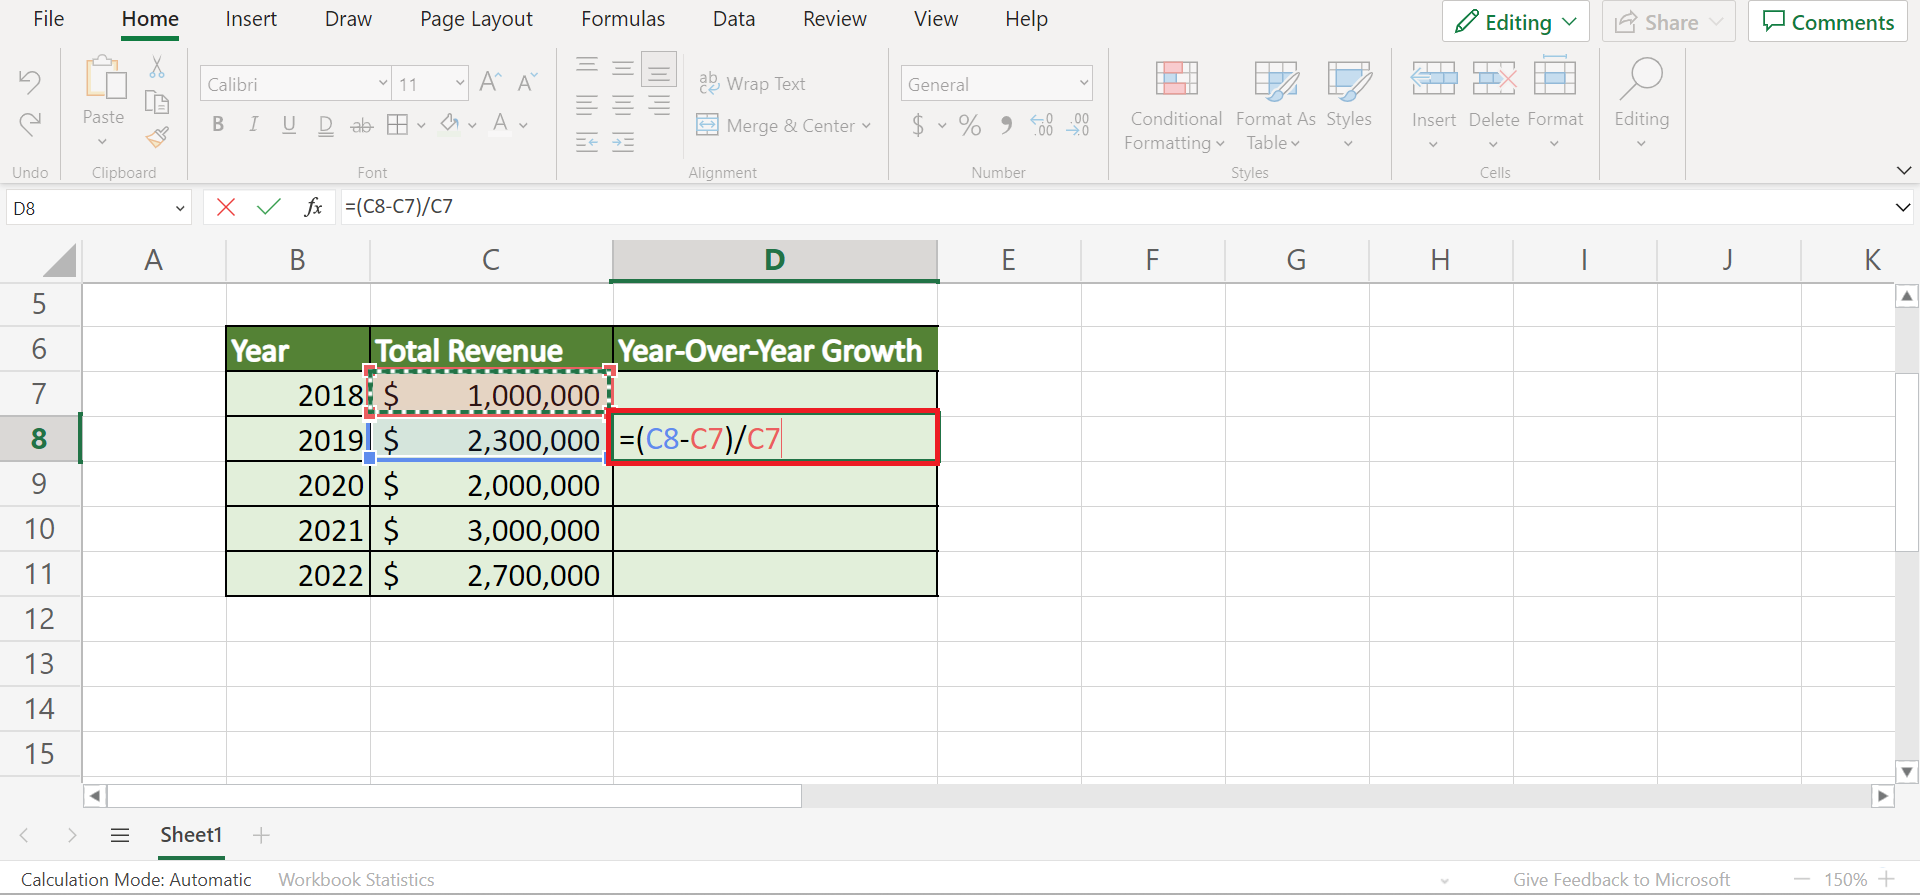
2. Secondly, we can drag down the Fill handle tool to copy the formula to the other cells.

3. Thirdly, we will change the format to percentage. So simply select the column containing the results. Next, we will go to the Home tab. Under the Number Format, we will select Percentage.
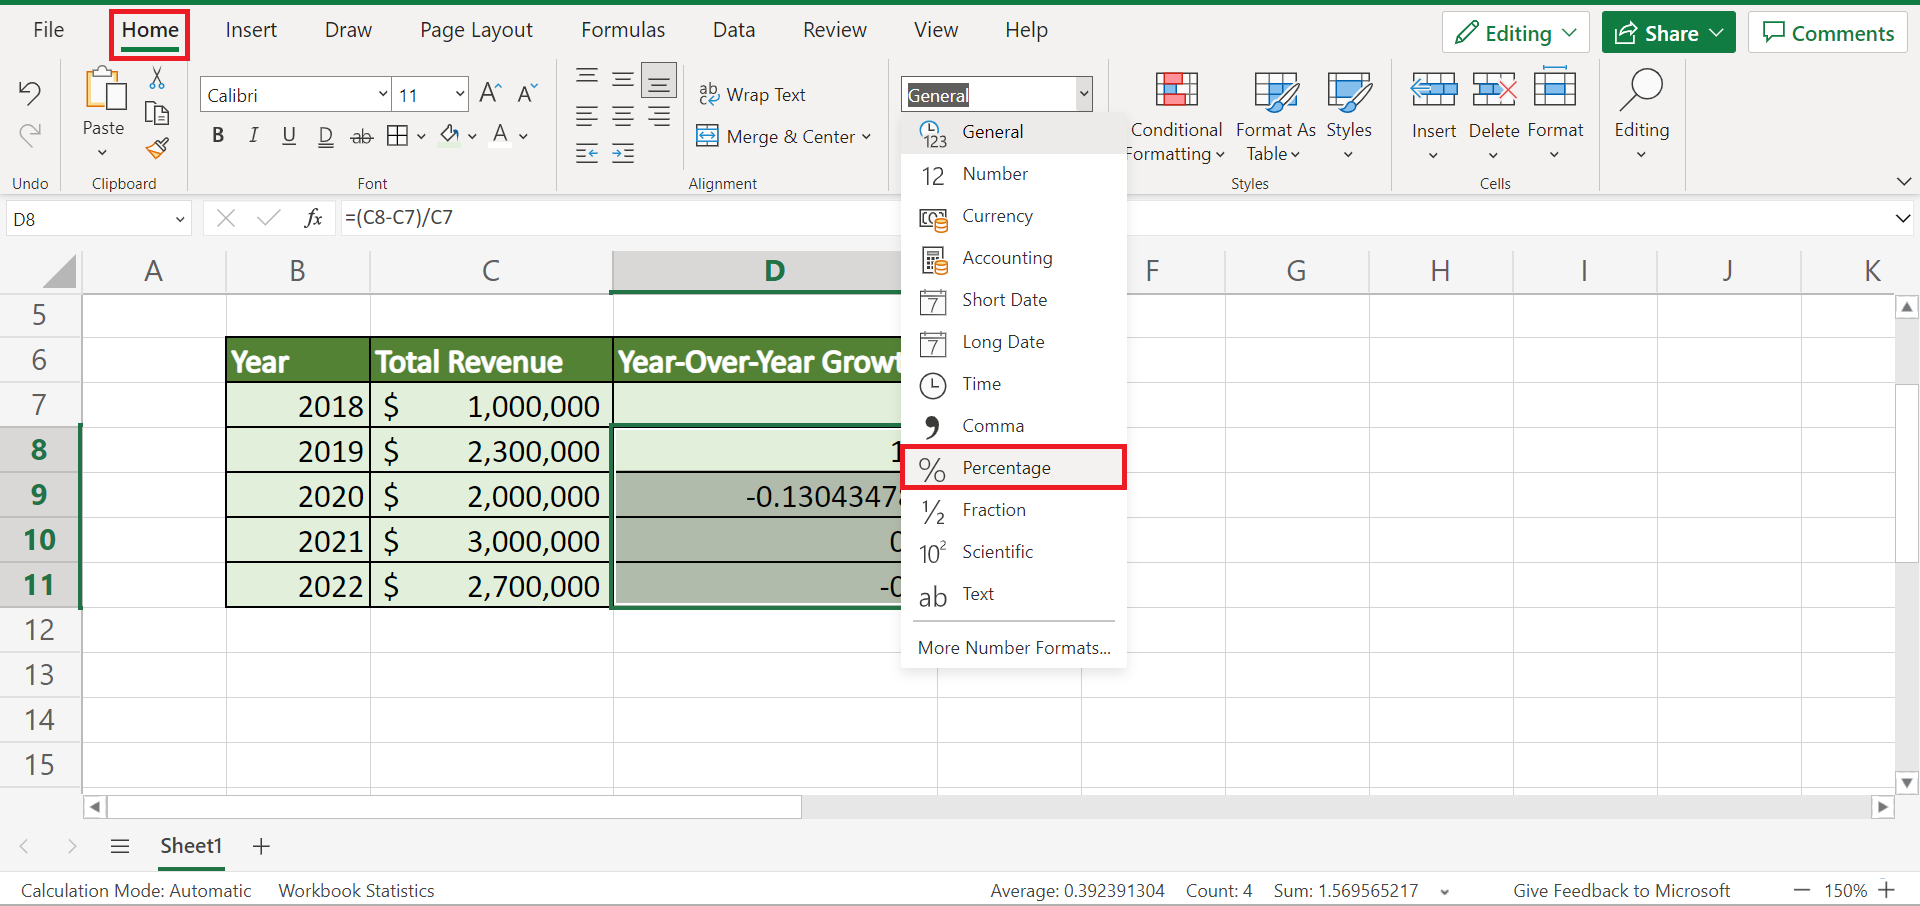
4. And tada! We have successfully calculated the year-over-year growth in Excel using the formula.

How to Calculate Year-Over-Year Growth in Excel Using the Advanced Formula
Secondly, we can utilize another formula to calculate the year-over-year growth in Excel. In this case, we have the same initial data set containing the year and total revenue of each year.
So our formula this time would be =(new value/ old value) - 1. Similarly, we can also use this formula for any type of percentage change or to obtain any change rate.
To use the advanced formula to get the year-over-year growth, simply follow the steps below:
1. Firstly, we will make a new column to input the results. Since the first year has no value before it, we cannot calculate the year-over-year growth. In this case, we will start calculating for the second year, which means we will type the formula in cell D8.
So type in the formula “=(C8/C7)-1”. Then, press the Enter key to return the result.

2. Secondly, we will drag the Fill handle tool down to apply the formula to the rest of the cells.

3. Thirdly, we will select the column containing the year-over-year growth. Next, we will head to the Home tab. Then, we will select Percentage under the Number Format.
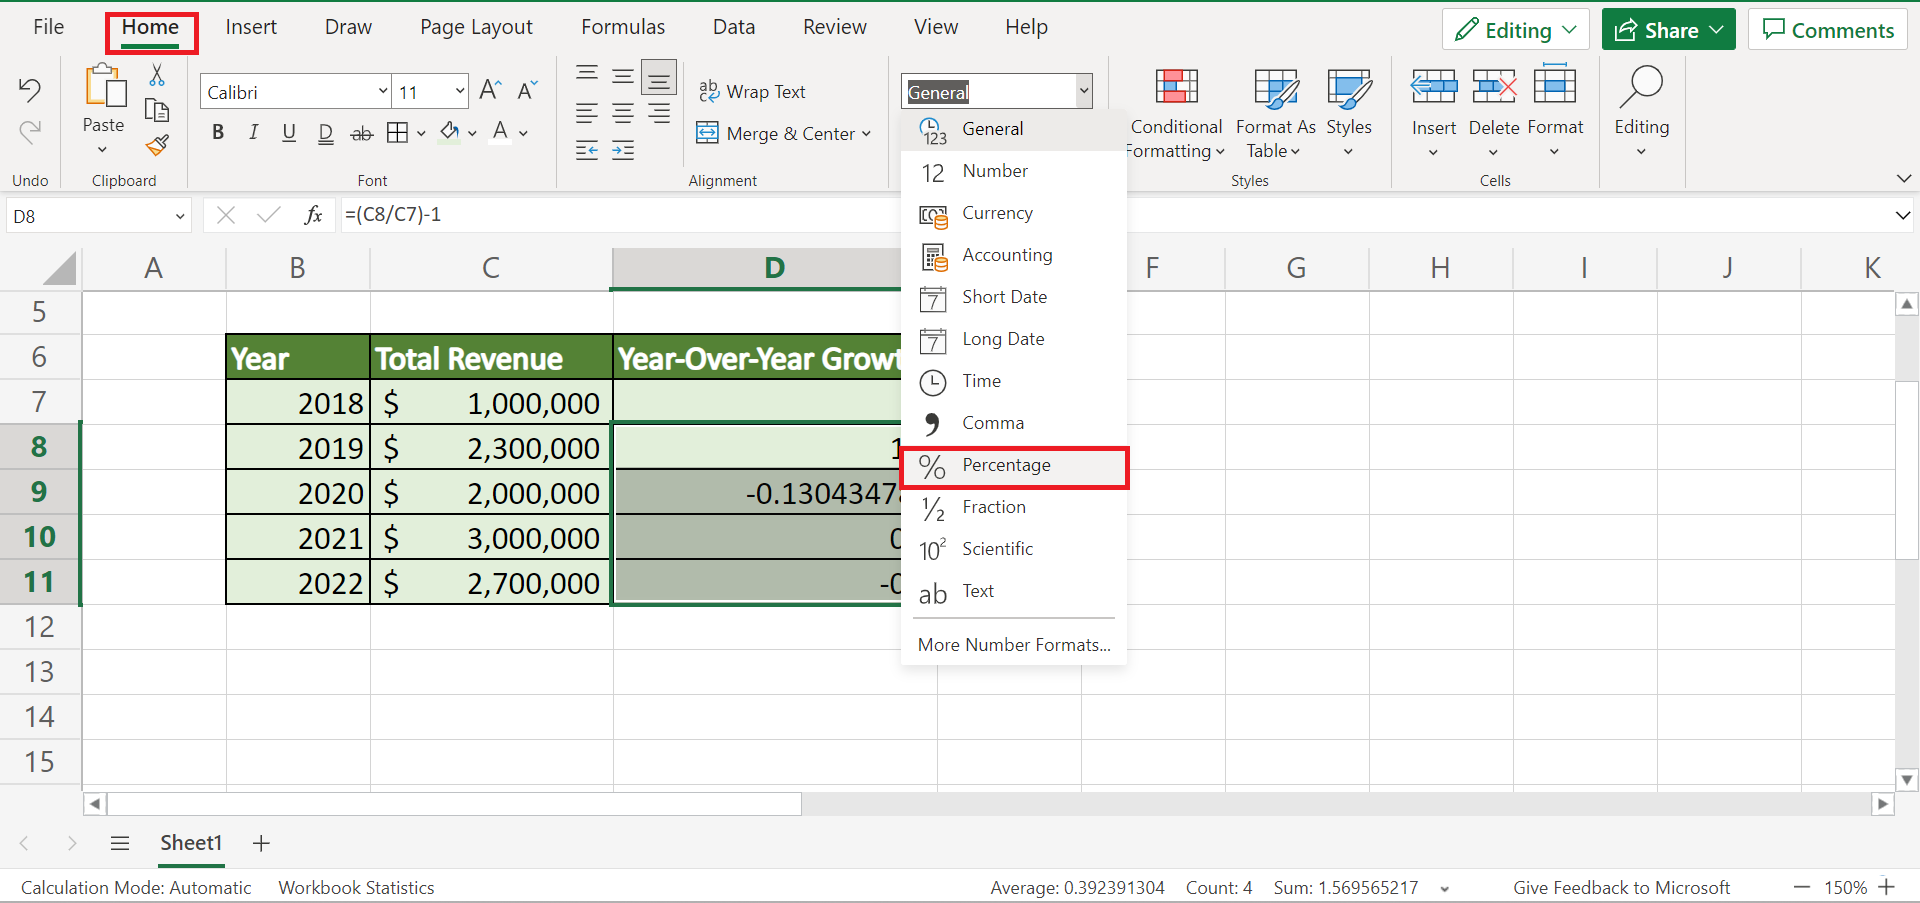
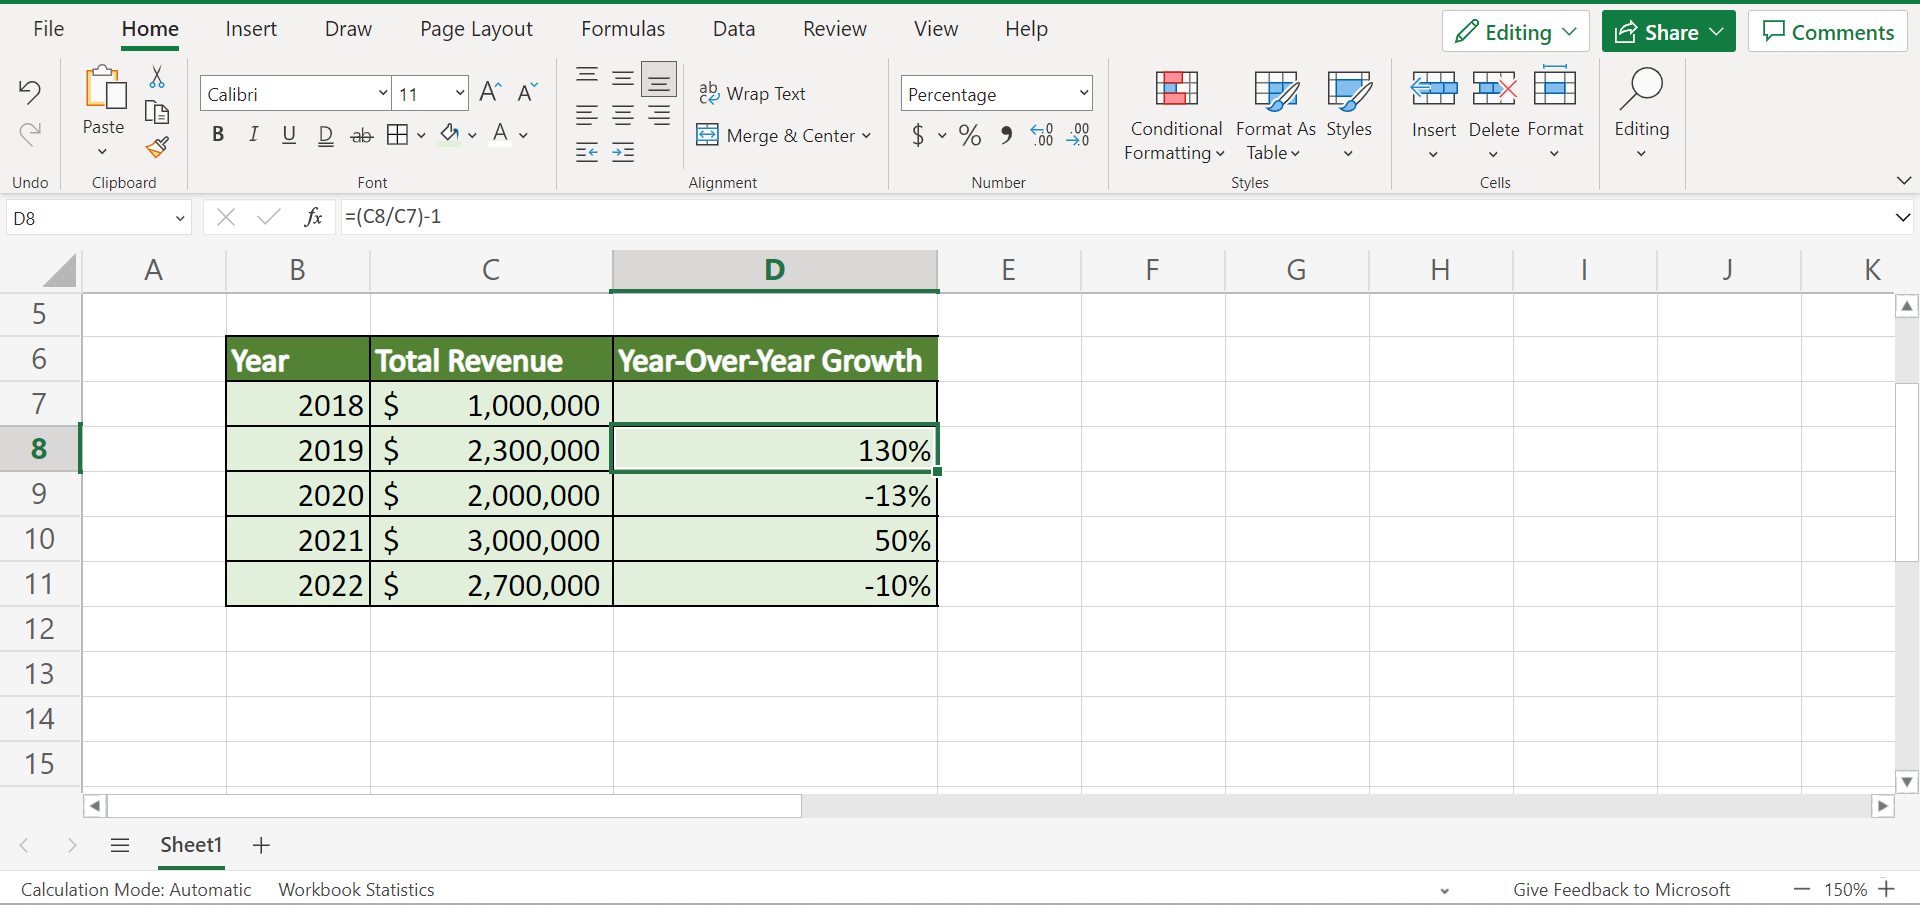
4. And tada! We have successfully obtained the year-over-year growth using the advanced formula.
How to Calculate Cumulative Year-Over-Year Growth in Excel
Another task we may want to perform in Excel is calculating the cumulative year-over-year growth instead of just the year-over-year growth. So the cumulative year-over-year growth would mean determining the changes over a certain period of time rather than just per year.
So we would have the same initial data set containing the years and the total revenue of each year. Furthermore, we need a common base value when calculating the cumulative year-over-year growth. And we will be calculating the year-over-year growth using that base value.
So our formula this time would be =( new value/ base value) - 1.
To calculate the cumulative year-over-year growth in Excel using this method, we can simply follow the process below:
1. Firstly, we will make a new column to input the results. In this case, our base value would be the value of the first year or the total revenue of 2018. Then, we can input the formula “=(C8/$C$7)-1” in cell D8. Lastly, press the Enter key to return the result.
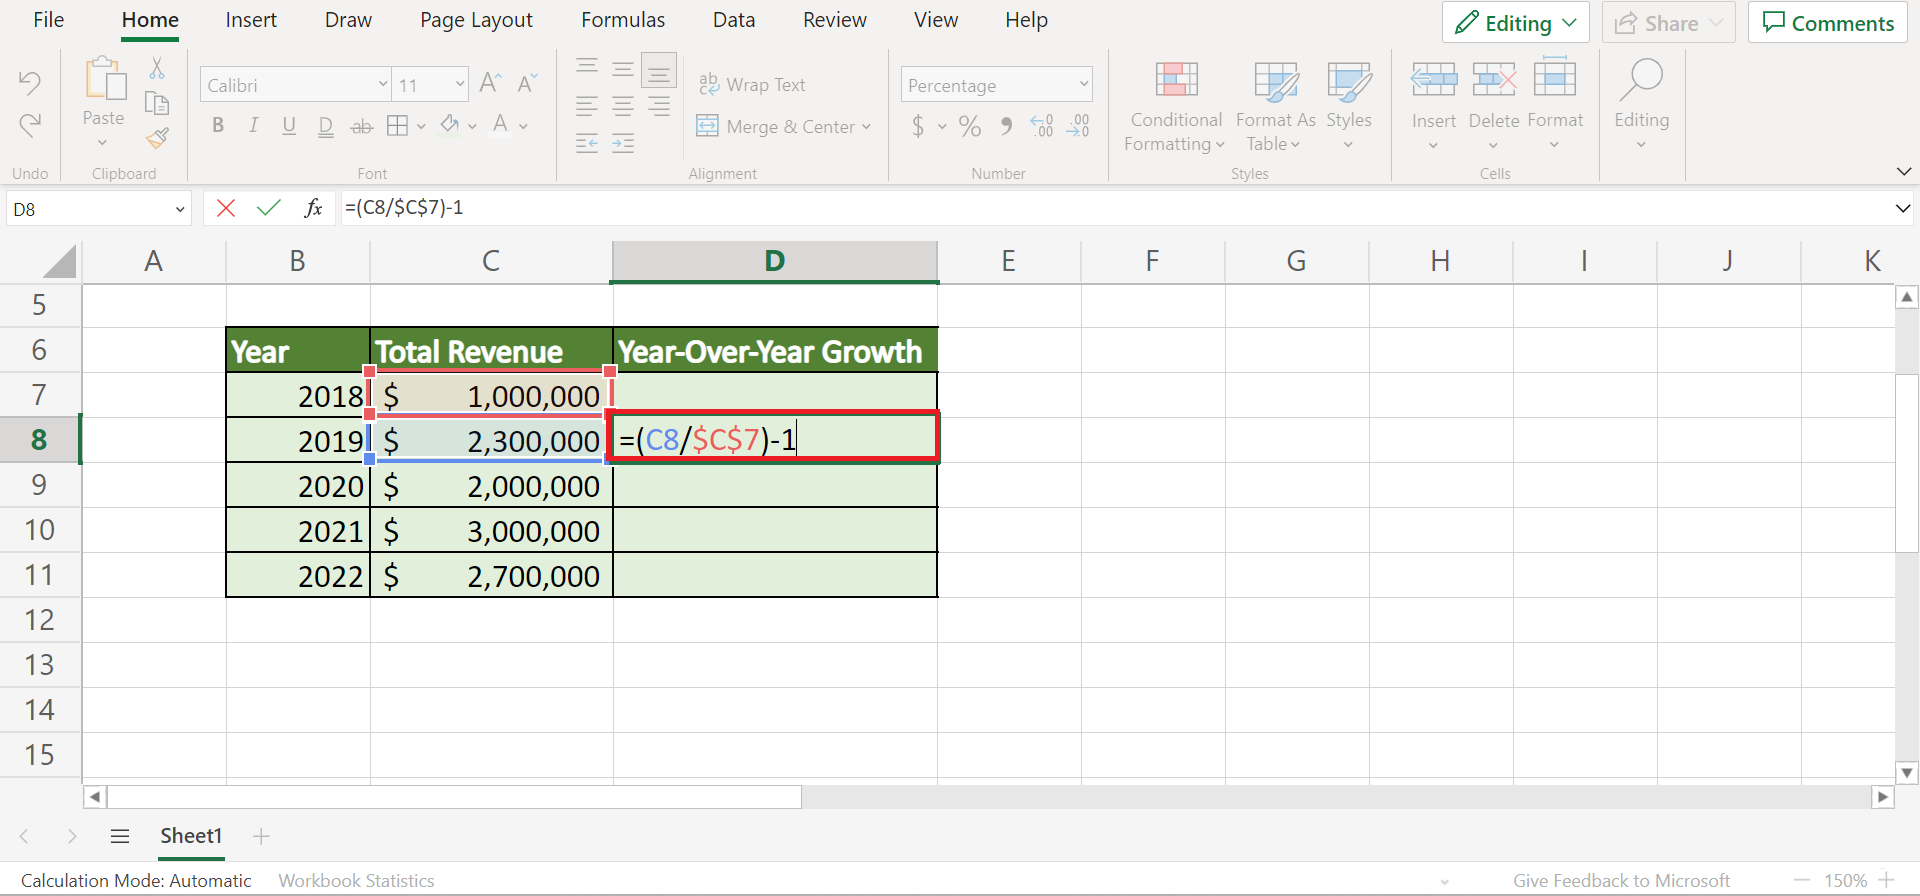
2. Secondly, we will drag down the fill handle to copy the formula and apply it to the other cells.
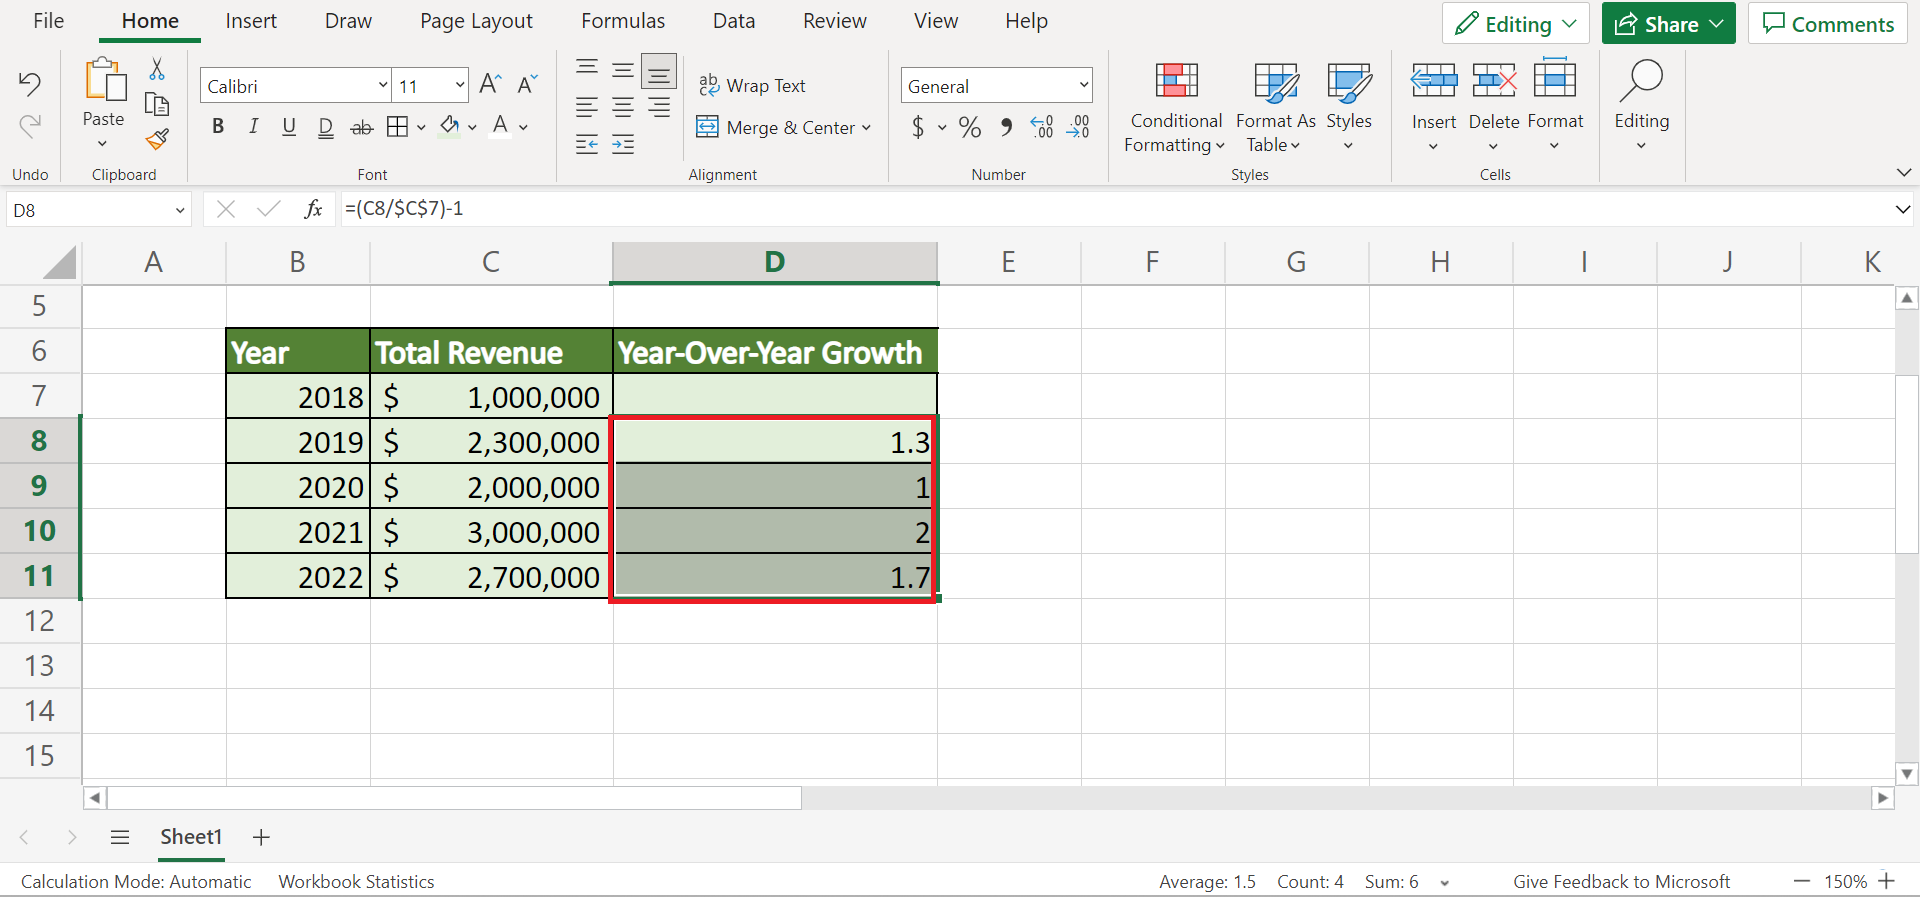
3. Thirdly, we need to change the format of the results. So select the entire column containing the results. Then, we will go to the Home tab and select Percentage under the Number Format.

4. And tada! We have successfully calculated the cumulative year-over-year growth in Excel.

How to Calculate Year-Over-Year Growth in Excel Using the IFERROR Function
Lastly, we can utilize the IFERROR function to get the year-over-year growth in Excel. But, we will have a different initial data set containing the value of the previous year and the current year’s value. Additionally, we will calculate the changes first. Then, we will determine the percentages.
So the IFERROR function returns a value, expression, or cell reference if the expression is an error and the value of the expression itself otherwise.
To use the IFERROR function to get the year-over-year growth in Excel, we can follow the steps below:
1. Firstly, we will need to set up our data set. So we will input the total revenue of each year in column C. Then, we will type the first value of column C in cell B8 to serve as last year’s value. Next, continue typing the previous year value based on column C.

2. Secondly, we will create another column to input the year-over-year changes. So we will type in the formula “=IFERROR(((C7/B7)-1),)”. Then, press the Enter key to return the result.

3. Thirdly, we will drag down the Fill handle tool to copy the formula to the other cells.
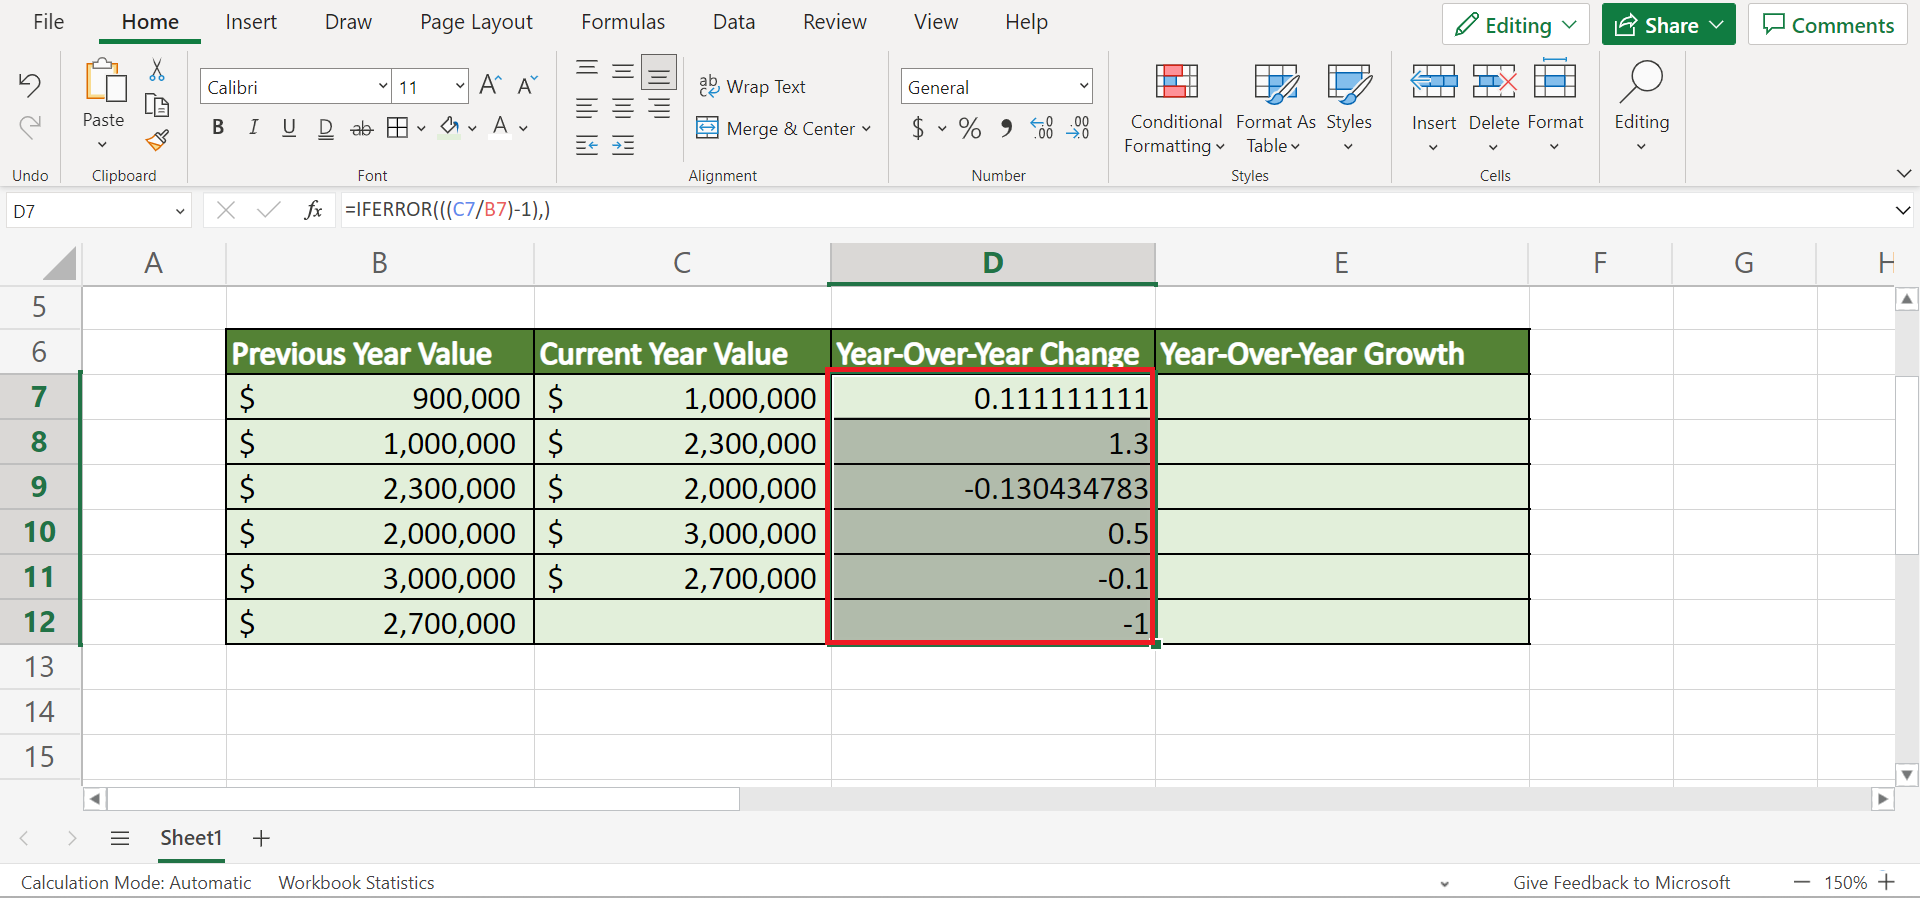
4. Next, we will copy the results and paste them into another column. Then, select the new column and go to the Home tab. Next, we will click Percentage under Number Format.

5. And tada! We have successfully used the IFERROR function to obtain the year-over-year growth in Excel.

You can make your own copy of the spreadsheet above using the link attached below.
And that’s pretty much it! We have explained how to calculate the year-over-year growth in Excel using four easy and simple methods. Now you can simply choose any of the methods and use them in your work whenever you need them.
Are you interested in learning more about what Excel can do? You can now use the IFERROR function and the various other Microsoft Excel formulas available to create great worksheets that work for you. Make sure to subscribe to our newsletter to be the first to know about the latest guides and tutorials from us.


