This guide will explain how to perform a correlation test in Excel.
We can use the CORREL function to determine how strong the correlation is between two variables. We can also use the Analysis Toolpak add-in to generate a correlation table between two or more variables.
A correlation test is used to determine if there is a relationship between two variables.
This test is important because it can help you understand how two variables are related. For example, if you wanted to know if there is a relationship between height and weight, you would use a correlation test.
The built-in CORREL function is the easiest method of performing a correlation test. It only requires two arguments: the x and y values.
However, the CORREL function may not be enough for use cases with more variables. Luckily, we can use the Correlation tool that comes with the Analysis Toolpak add-in to create a correlation table. The table can show which variables in your dataset correlate the most.
Now that we know when to perform a correlation test, let’s learn how to use it and work on an actual sample spreadsheet.
A Real Example of a Correlation Test in Excel
The following section provides several examples of how to perform a correlation test in Excel. We will also explain the formulas and tools used in these examples.
First, let’s take a look at our sample data. The sample spreadsheet includes a table of x and y values. We want to know the correlation between these variables.

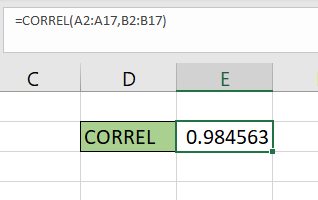
We can use the CORREL function to find the correlation coefficient between x and y.
A correlation coefficient close to 1 suggests a strong positive correlation. A coefficient close to -1 suggests a strong negative correlation. Coefficients near 0 indicate an absence of any relationship between either variable.
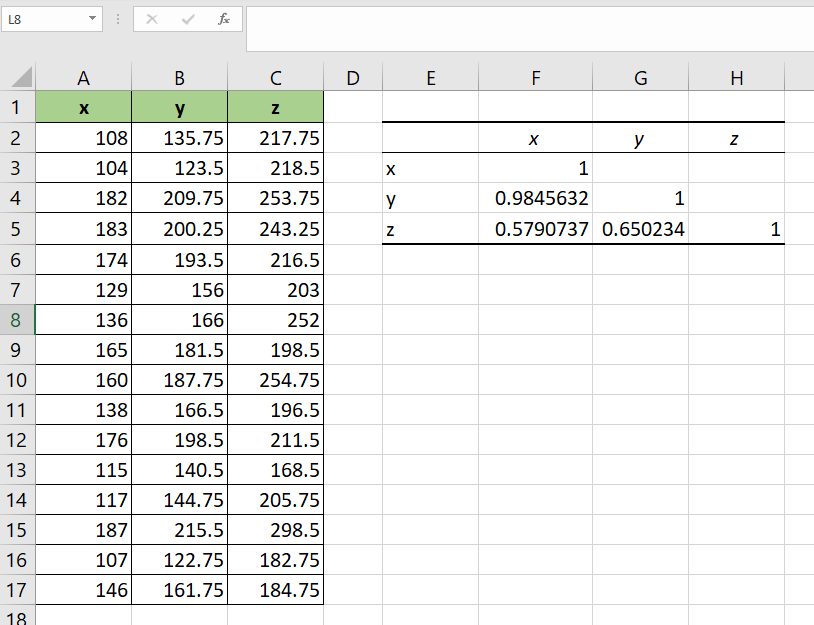
We can also use the Analysis Toolpak add-in to create our own correlation coefficient table. This option works best when comparing three or more variables.
Do you want to take a closer look at our examples? You can make your own copy of the spreadsheet above using the link attached below.
If you’re ready to try out the CORREL function or Analysis Toolpak yourself, head over to the next section to read our step-by-step breakdown on how to use these methods.
How to Perform a Correlation Test in Excel
This section will guide you through each step needed to perform a correlation test in Excel. You’ll learn how we can use the CORREL function and the Analysis Toolpak add-in to find the correlation between two or more variables.
Follow these steps to perform the correlation test in Excel:
- First, we’ll use Excel functions to perform our correlation test. Select the cell where you will place the
CORRELformula.
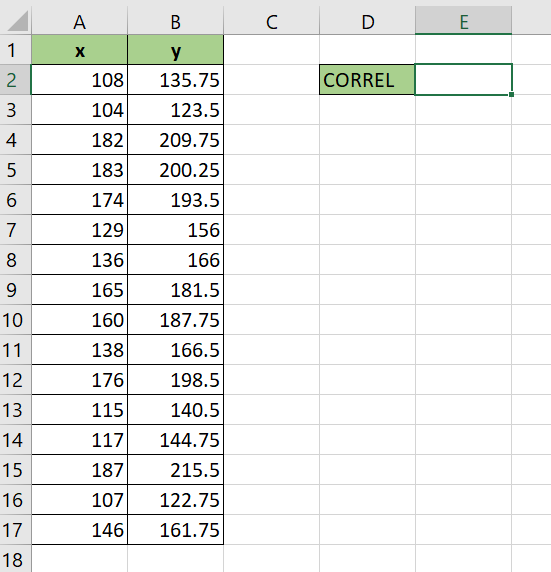 In this example, we’ll place our correlation value in cell E2.
 - Next, add the ranges with our x and y values as arguments to the
CORRELfunction.
- Type the Enter key to evaluate the result. In this example, we find out that our x and y values have a correlation of 0.98.
- Next, we’ll create a correlation table using the Analysis Toolpak add-in. The add-in comes with the latest Desktop editions of Microsoft Excel but is not installed by default. To install the add-in, click on File.

- In the File menu, click on the Options button on the lower-left corner.

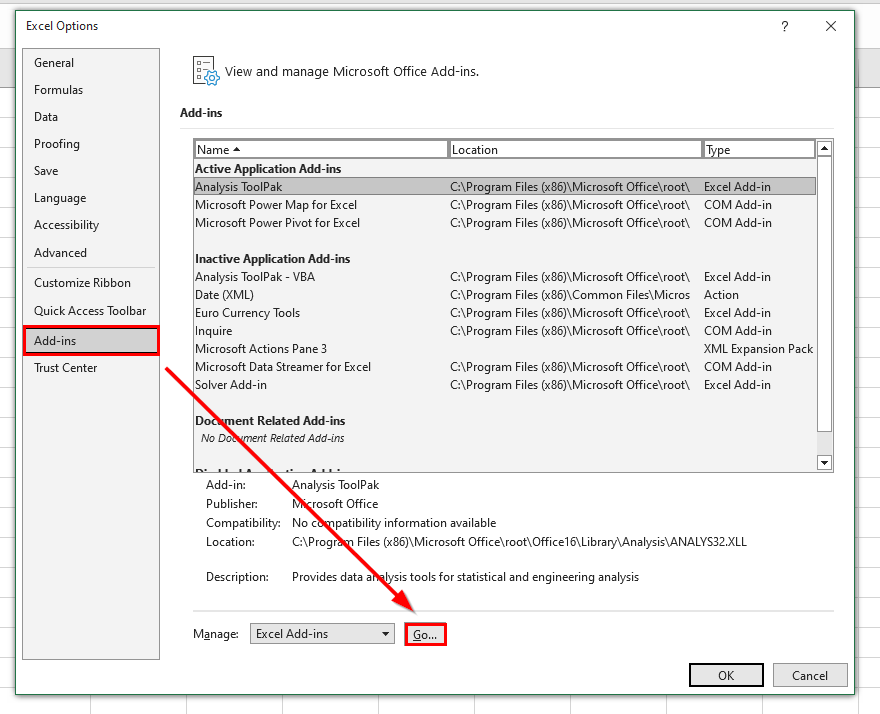
- In the Excel Options dialog box, click on the Add-ins tab and select the Go.. button.
- Click on the checkbox next to the Analysis Toolpak option. This add-in comes with various tools you can use to perform statistical analysis. Select OK to proceed with installing the add-in.

- You can find the Data Analysis option in the Data tab.

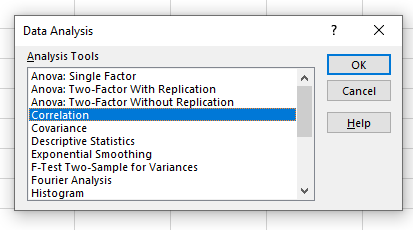
- Clicking on the Data Analysis option will open a new dialog box. The pop-up lists over a dozen tools you can use for statistical analysis. Select the Correlation option and click OK.
- In the Input Range textbox, type the range with both x and y values. You must also select the Columns option under the Grouped By label. We must also indicate the range where the Correlation tool will place the output
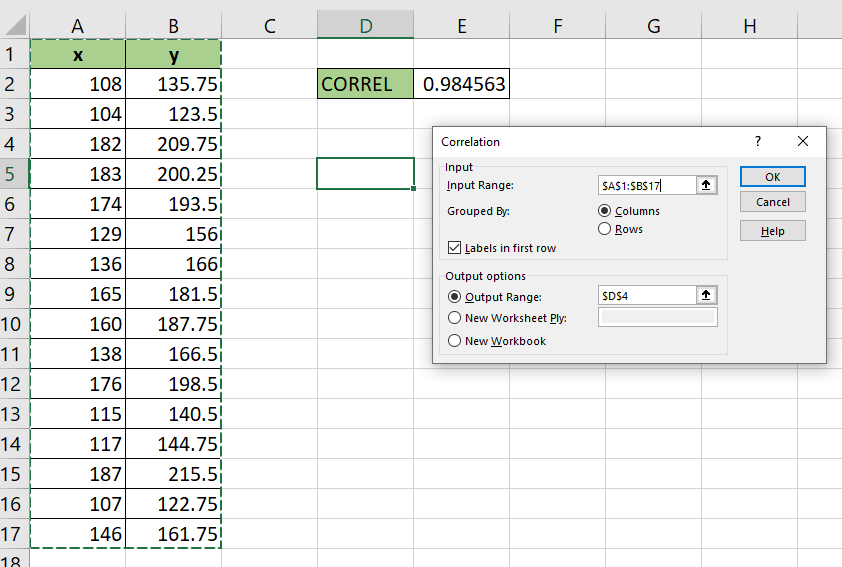 Since our range includes headers, we’ll also check the option that indicates that the first row is reserved for the column labels.
 - The correlation tool will output a table that shows the correlation between the x and y values.
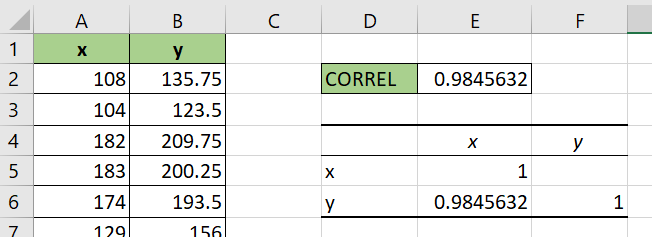
- The correlation table is most helpful when comparing three or more variables.
These are all the steps needed to perform a correlation test in Excel.
This step-by-step guide should provide you with all the information you need to perform a correlation test in Excel.
We’ve explained two different methods to find the correlation value between two variables. With the Analysis Toolpak add-in, you can even create a correlation table to compare three or more variables.
This function is just one example of the many Excel functions you can use in your spreadsheets. Our website offers hundreds of other functions and methods to help you get more out of Microsoft Excel.
With so many other Excel functions available, you can find one appropriate for your use case.
Don’t miss out on our team’s new spreadsheet tips, tricks, and best practices. Subscribe to our newsletter to stay updated on the latest guides from us!