This guide will explain how to use multinomial distribution in Excel.
We can use this type of distribution to find the probability of several different outcomes occurring at once.
A multinomial distribution models the probability of receiving a certain set of counts for different outcomes assuming each outcome has a fixed probability.
A common use case for multinomial distribution is for determining the likelihood of a result from a random sample of a known finite population.
Let’s take a look at a quick example where we can use the multinomial distribution.
Suppose you have a bag containing six marbles: three red marbles, two blue marbles, and a single green marble. You want to know how likely it is to get one of each color after retrieving a random sample of three marbles from the bag with replacement.
To solve for the multinomial distribution, we must first identify the probability of each color being picked from the bag. After we find the probability of each outcome, we can use the MULTINOMIAL formula to find the probability of our desired outcomes happening.
This use case is one way we can use multinomial distribution in Excel. We can use the multinomial distribution for any scenario where we already know the probabilities of each outcome.
Now that we know when to use the multinomial distribution, let’s learn how to use it and work on an actual sample spreadsheet.
A Real Example of Using Multinomial Distribution in Excel
The following section provides several examples of how to use the multinomial distribution. We will also explain the formulas and tools used in these examples.
First, let’s describe our first scenario. In the spreadsheet below, we’re modeling a scenario where we draw a random sample of three marbles from a bag. We know that there are four yellow marbles, two blue marbles, and two red marbles.
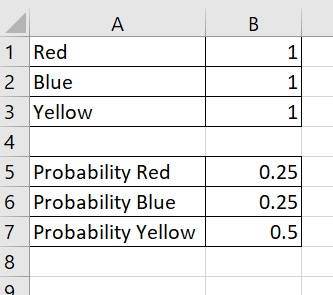
From what we know of the population, we write down the probability of returning any of the three colors when we draw at random.
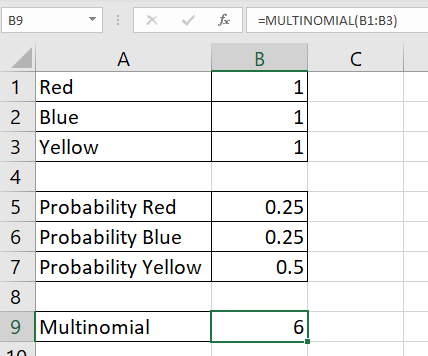
Next, we’ll use Excel formulas to find the probability that drawing three marbles will give us one of each color. We’ll use the MULTINOMIAL function to find the multinomial value to use in our distribution formula later.

We can find the value in cell B14 by using the following formula:
=B9*PRODUCT(B10:B12)
Do you want to take a closer look at our examples? You can make your own copy of the spreadsheet above using the link attached below.
If you’re ready to use the multinomial distribution in Excel, head over to the next section to read our step-by-step breakdown on how to do it!
How to Use Multinomial Distribution in Excel
This section will guide you through each step needed to start using multinomial distribution in Excel. You’ll learn how to find the multinomial using an Excel function. We’ll explain how to use the probabilities of each outcome to compute the final probability.
In this example, we want to return exactly one marble of each color. Our bag contains four yellow marbles, two blue marbles, and two red marbles.
Follow these steps to start using multinomial distribution in Excel:
- Since we want a single count of each color, we’ll set a count of 1 for each outcome. Next, we’ll indicate the probability of drawing a particular color from the bag.
We can find this number by dividing the number of objects with the desired feature by the total number of objects. For example, two blue marbles divided by eight marbles is 0.25. - Next, we’ll use the
MULTINOMIALfunction to find the ratio of a sum of values to the product of factorials. The values we’ll choose are in the range B1:B3.
- Next, we’ll find the value equal to the probability of the outcome raised to a power equal to the count of that outcome desired.

- We’ll perform the same operation for the other two possible outcomes.

- We’ll multiply our multinomial value by the result of the
PRODUCTfunction given our range B10:B12.

- Hit the Enter key to return the probability. In this example, we’ve determined that there is an 18.75% chance for a random sample of three marbles from the bag to be a combination of all three colors.
These are all the steps needed to perform multinomial distribution in Excel.
Frequently Asked Questions (FAQ)
Here are some frequently asked questions about using the multinomial distribution in Excel:
- What is the difference between the multinomial and binomial distributions?
In statistics, multinomial distribution is a generalization of a binomial distribution. This means that the multinomial distribution covers other types of distributions, such as the categorical distribution. The multinomial distribution is binomial for cases where k is 2 and n is larger than 1.
This step-by-step guide should provide you with all the information you need to begin using the MULTINOMIAL function in Excel.
You should now understand when to use the multinomial distribution and how to calculate the probability yourself in Excel.
The multinomial distribution is just one example of the many statistical distributions you can use in your spreadsheets. Our website offers hundreds of other functions and methods to help you get more out of Microsoft Excel.
With so many other Excel functions available, you can find one appropriate for your use case.
Don’t miss out on our team’s new spreadsheet tips, tricks, and best practices. Subscribe to our newsletter to stay updated on the latest guides from us!