This guide will explain how to use exponential smoothing in Excel using the data analysis tool.
Excel is a popular tool that many people use for several different things—for example, presenting data, doing reports, calculations, or data analysis. And Excel makes data analysis so simple and quick.
One of these data analyses is exponential smoothing. So exponential smoothing is a popular sales forecasting method that is often used in statistics. And exponential smoothing emphasizes weighted averaging factors.
So the fresher or younger, the data is more relevant and is given more significance. While the older data is given less priority or weight. Basically, it gives importance to the most recent or new data or observations. Additionally, exponential smoothing is used to predict trend projection.
Let’s take a sample scenario.
Suppose you were tasked to perform exponential smoothing for last year’s price per month. But, you did not want to go through the entire process by manually performing calculations. So you opted to use the data analysis tool in Excel to make the task easier and faster.
Great! Now let’s move on and discuss a real example of using exponential smoothing in Excel.
A Real Example of Using Exponential Smoothing in Excel
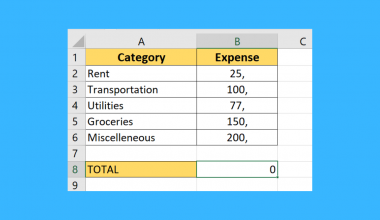
Let’s say we have an initial data set containing the months, the period of the months, and the price of each month. So it would look something like this:

Before we start performing the data analysis of exponential smoothing, let’s try to learn the different types of exponential smoothing that are available in Excel.
Firstly, an important aspect of exponential smoothing is the alpha value with the symbol α. And the alpha value is the threshold of statistical significance. Then, let’s discuss the three types of exponential smoothing.
Firstly, we have the simple or single exponential smoothing. In this type of exponential smoothing, the alpha value is very close to zero meaning the smoothing rate is very slow.
Secondly, we have double exponential smoothing. And this type of exponential smoothing is often used for data analysis which contains more trend indicators.
Lastly, we have the triple exponential smoothing. So this type of exponential smoothing is often for data that shows more trend and seasonality in the series.
After learning the types of exponential smoothing, we can start using them in Excel. And to use exponential smoothing in Excel, we need to utilize the data analysis feature of Excel.
Under the data analysis feature of Excel, we can find exponential smoothing and apply it to our data set. After inputting the necessary details in the data analysis, a graph will appear in the worksheet showing the exponential smoothing of our data set.
And our final worksheet would look something like this:

You can make your own copy of the spreadsheet above using the link attached below.
Awesome! Now let’s dive into the steps of how to use exponential smoothing in Excel using the data analysis tool.
How to Use Exponential Smoothing in Excel
In this section, we will learn the step-by-step process of how to use exponential smoothing in Excel using the data analysis tool. Additionally, each step will contain detailed instructions and pictures to guide you through the entire process.
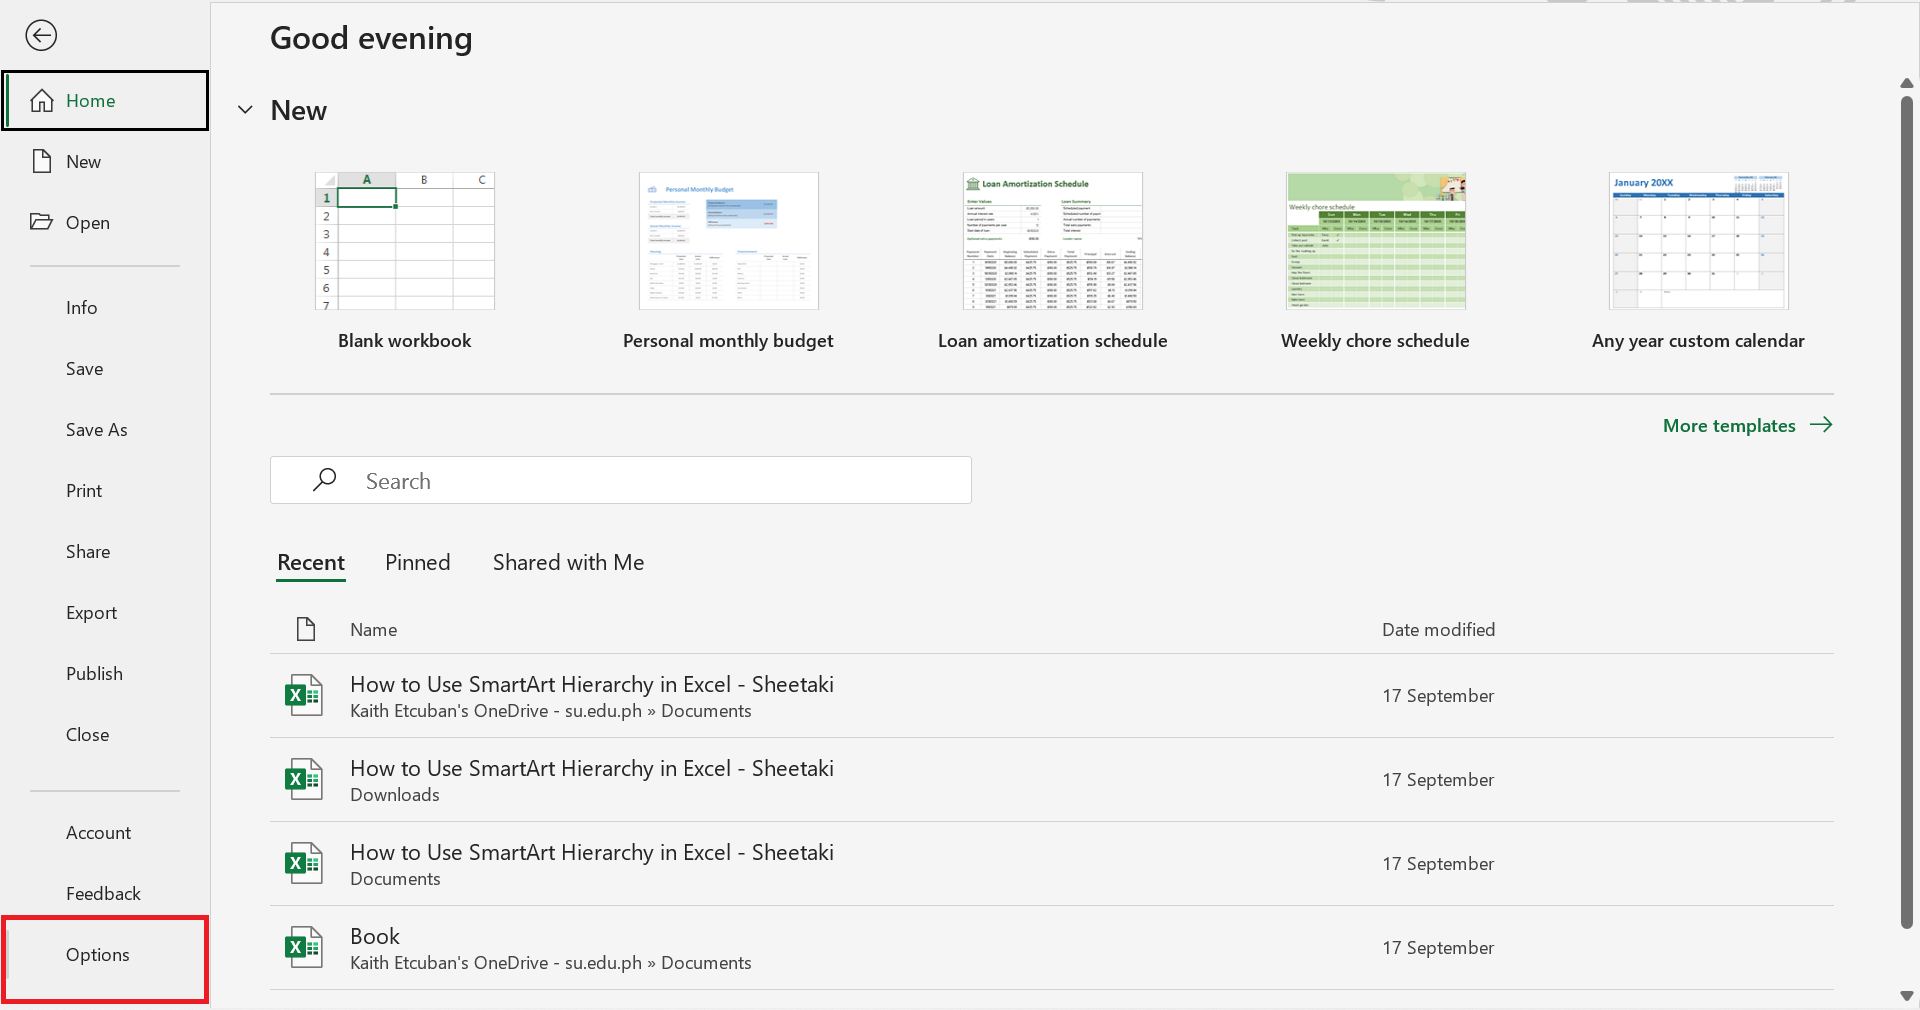
1. Firstly, we need to add the Data Analysis tool to our ribbon because it may not be available yet. To add the Data Analysis tool to the ribbon, go to the File tab. Then, click on Options.
2. Secondly, we will go to the Add-ins section. Under Manage, select the dropdown menu and click on Excel Add-ins. Lastly, click Go beside the dropdown menu.
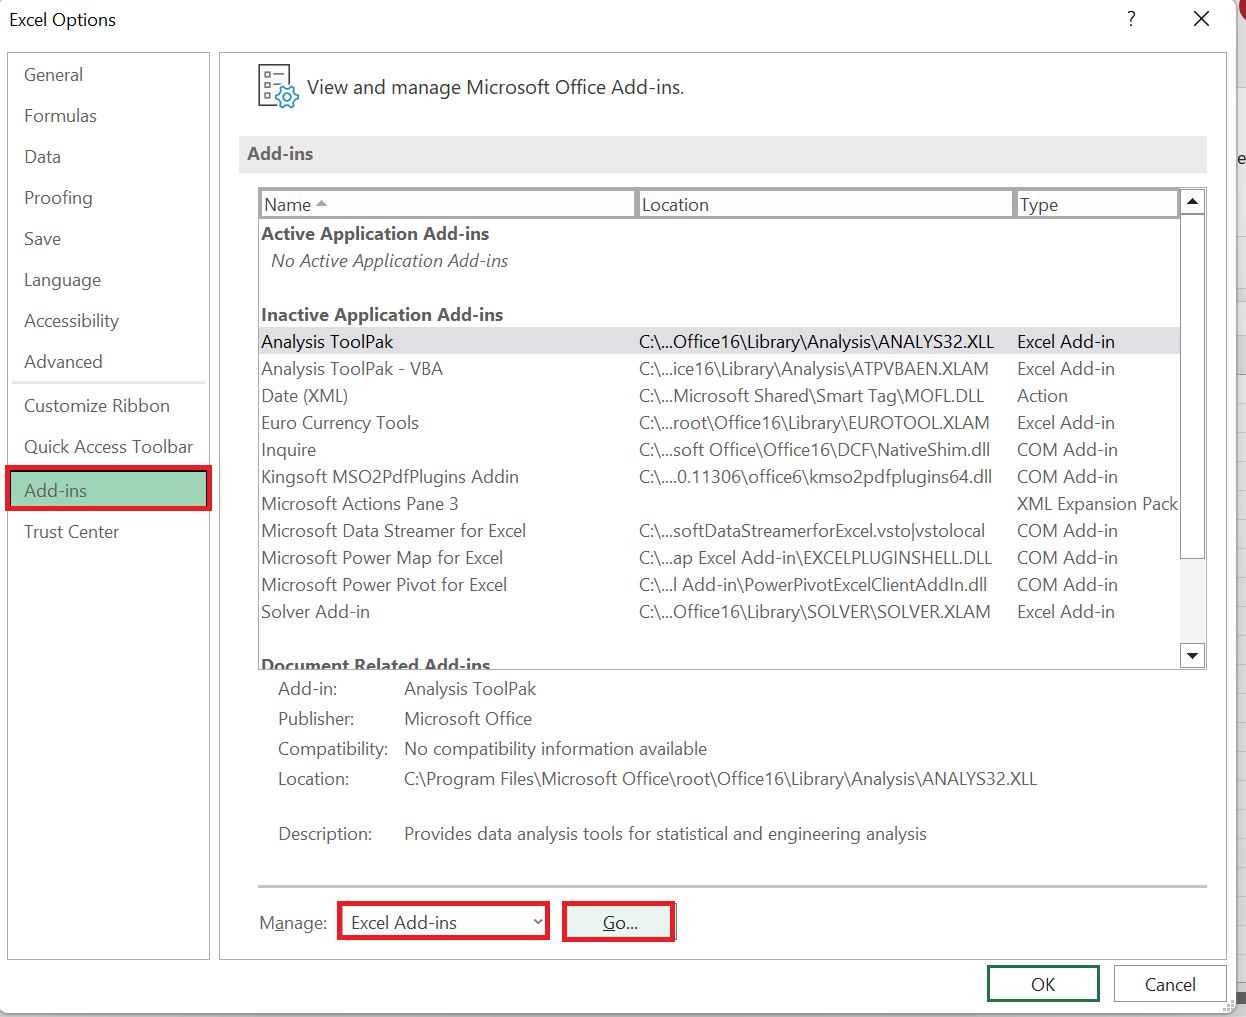
3. Thirdly, the Add-ins window will open. Then, check Analysis ToolPak under the Add-ins available menu. Lastly, click OK to apply the changes.

4. So, the Data Analysis tool should have been added to our ribbon now. To check, go to the Data tab, and it should be there. Next, click Data Analysis to start performing exponential smoothing.

5. Afterward, the Data Analysis window will appear. Then, select Exponential Smoothing under the Analysis Tools menu. Lastly, click on OK.

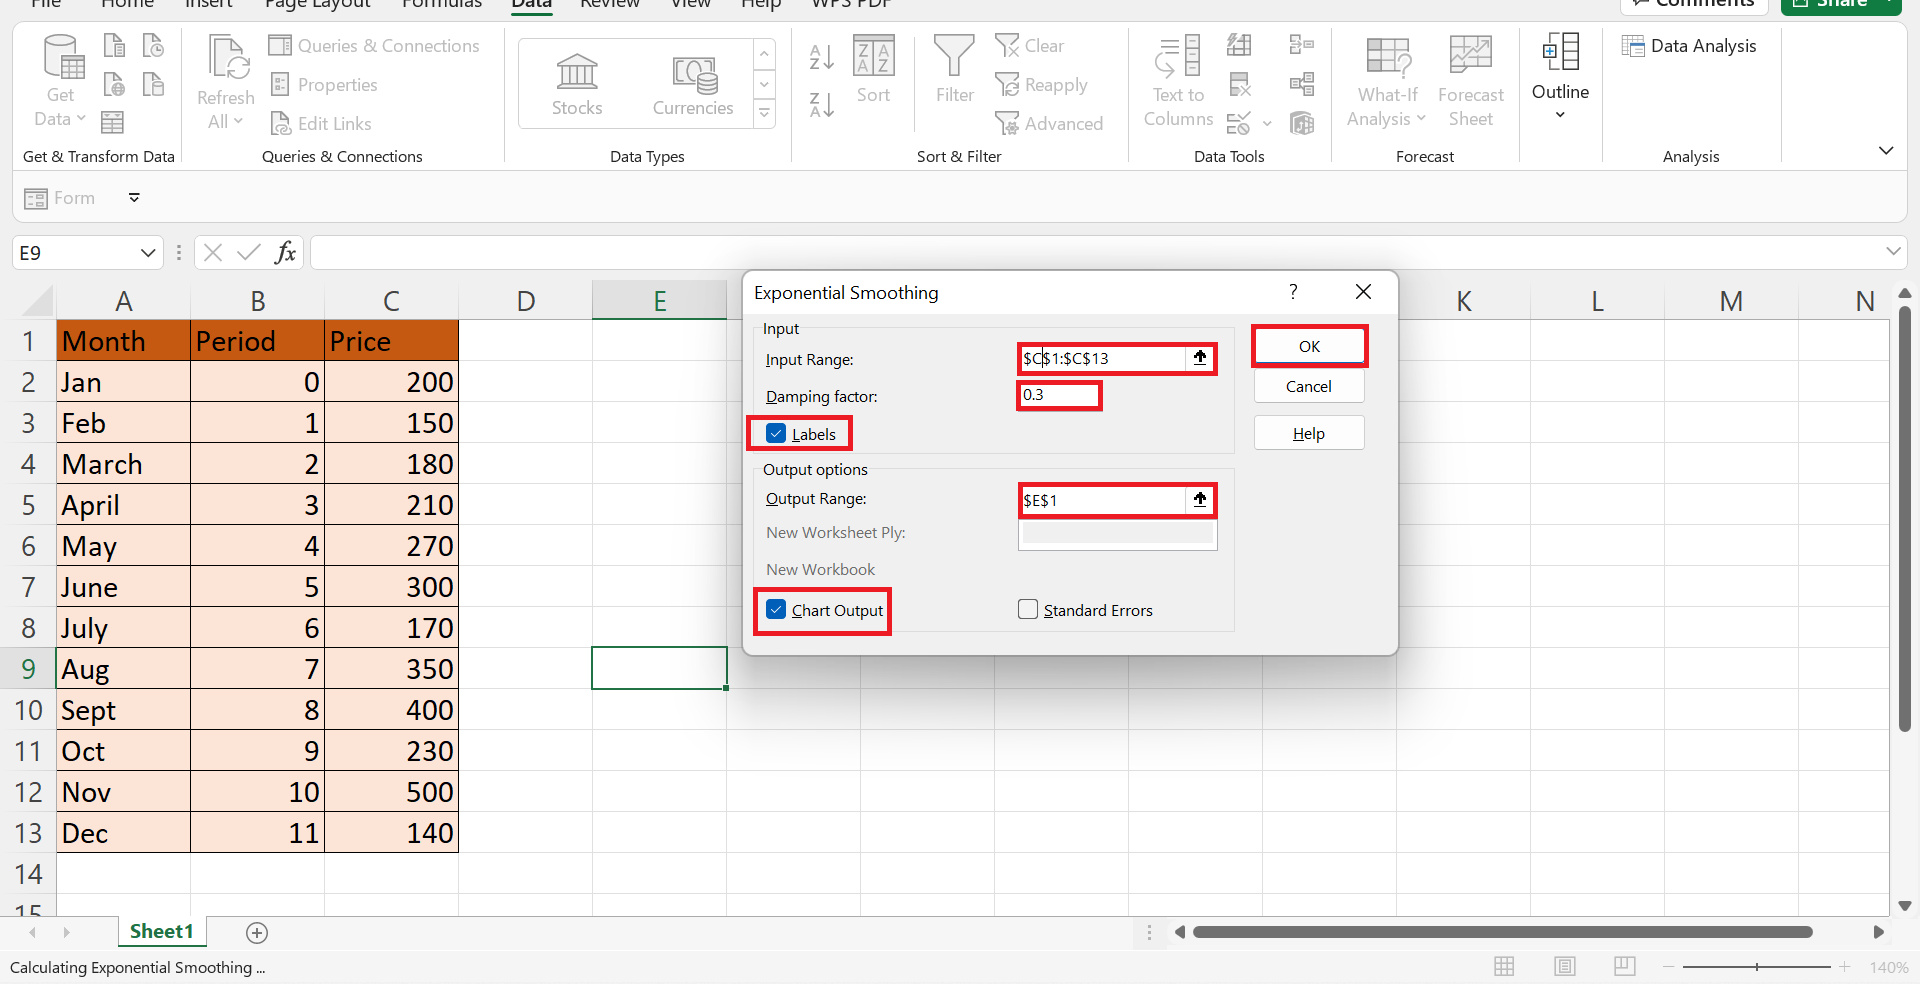
6. And the Exponential Smoothing window will open. Next, input the range containing the data set in the Input Range space. In this case, we will input “$C$1:$C$13” Then, we need to input the Damping factor, which will smooth out the graph. And it should be between the values of 0 to 1. For instance, we will type “0.3”.
Next, we will check the checkbox for Labels. Afterward, input the range where we want to display the results. In this case, we will input “$E$1” in the Output Range. Then, check the Chart Output options to display a graph representing the results. Finally, click OK to apply all of the details.
7. And tada! We have successfully used exponential smoothing in Excel using the data analysis tool.
And that’s pretty much it! Wasn’t it far simpler and faster than you thought? Since we have explained how to use exponential smoothing in Excel using the data analysis tool, you can start applying this whenever you need to perform it.
Are you interested in learning more about what Excel can do? You can now use the various other Microsoft Excel formulas available to create great worksheets that work for you. Make sure to subscribe to our newsletter to be the first to know about the latest guides and tutorials from us.