

This guide will explain how to calculate the standardized residuals in Excel.
The standardized residual is a statistic used in linear regression analysis to assess the goodness of fit of a certain regression model. These values are also useful for detecting outliers and influential data points in a dataset.
For example, an observation with a standardized residual greater than 2 or less than -2 can be considered a potential outlier.
To find the standardized residuals in Excel, we’ll have to compute the residual and leverage of each observation. We must also use the DEVSQ function to find the sum of the squared deviations of the independent variable.
In this guide, we will present a step-by-step tutorial on calculating the standardized residual. We will cover how to find the initial residual values and how to convert those values into standardized residuals.
Let’s dive right in!
A Real Example of Calculating Standardized Residuals in Excel
Let’s explore a simple example where we may need to calculate standardized residuals in Excel.
In the table seen below, we have a dataset with an independent variable x and a dependent variable y.

We will need to perform several different calculations to find the standardized residuals of each observation in our dataset.
The residual values in column D is calculated as the difference between the observed y value and the predicted y value using the regression model.
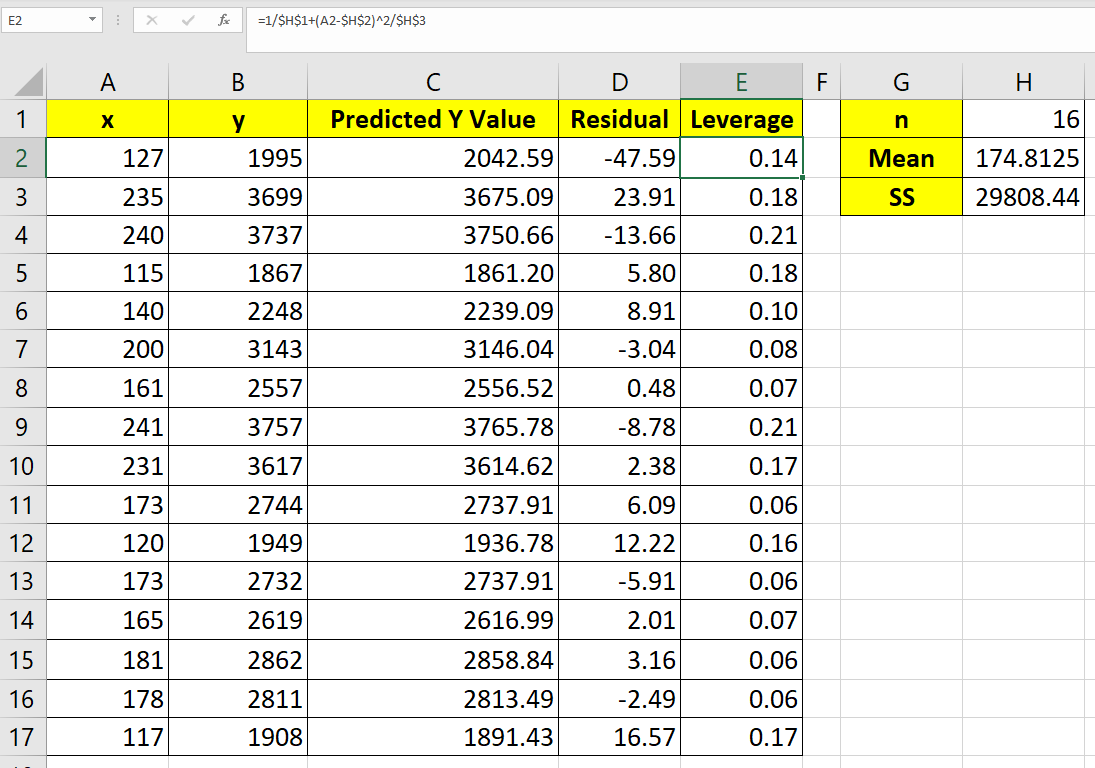
After finding all residuals, we’ll also need to find the leverage of each observation. The leverage of an independent variable indicates how much influence the variable has on the result.
We can find the leverage hi using the following formula:
hi = 1/n + [(xi - x̄ )2/SSx]
In the formula above, xi refers to our observed value, x̄ is our predicted value, n is the number of observations, and SSx refers to the sum of the squared deviations from the sample mean of the independent variable.
Once we have the leverage, we can use the following formula to find the standardized residual:
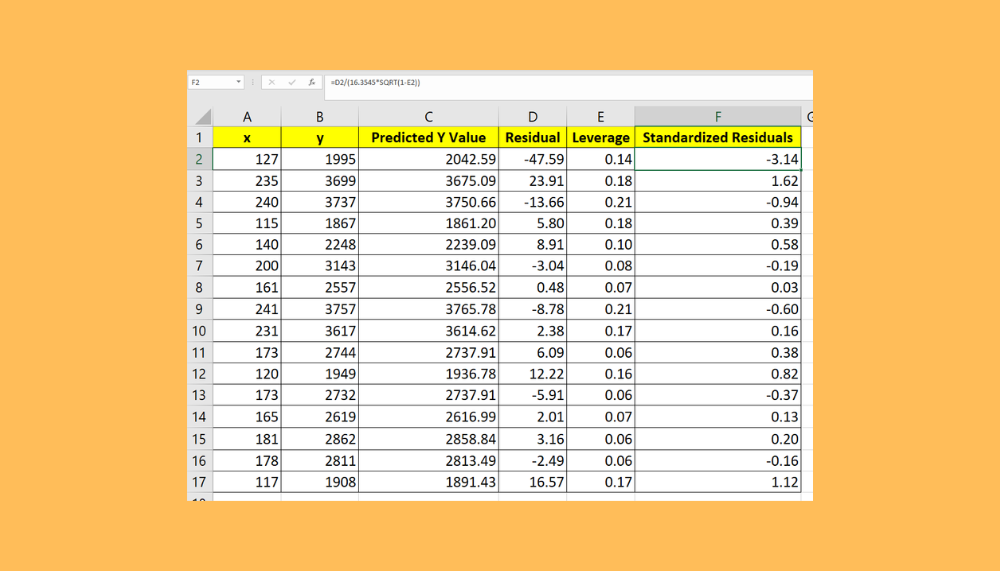
standardized residual = residual/RSE* SQRT(1 - leverage)

In the example above, we’ve determined that the first observation is a potential outlier.

After plotting the x and y values in a a scatterplot graph, we can confirm that the first observation is an outlier value in the dataset.
Do you want to take a closer look at our examples? You can make your own copy of the spreadsheet above using the link attached below.
Use our sample spreadsheet to see all the formulas used to calculate the standardized residuals in Excel.
If you’re ready to try calculating standardized residuals yourself, head over to the next section to read our step-by-step breakdown on how to do it!
How to Calculate Standardized Residuals in Excel
This section will guide you through each step needed to find the standardized residuals of your regression model in Microsoft Excel.
Follow these steps to start finding outliers through this technique:
- To find the standardized residuals, we must first calculate the residuals of the regression model. We can use the Regression tool in the Analysis Toolpak add-in to quickly find the regression equation’s coefficients.

- Next, we’ll use the coefficients to find the predicted y value. For example, using the coefficients found in the prior step, we can find the predicted y value of the first observations using the formula
=(127)*15.116+122.896.
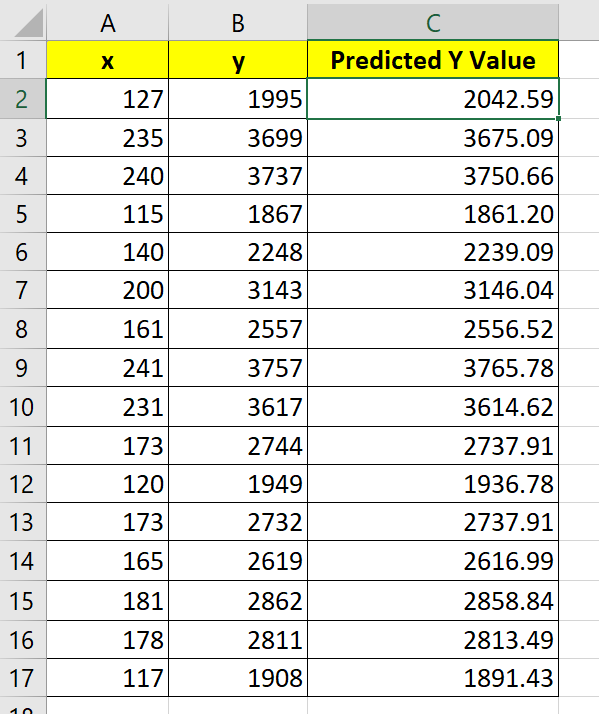
- The residual of each observation is simply the difference between the observed y value and the predicted y value.

- Next, we must find the value of n. Since n is just the total number of observations, we can use the
COUNTfunction on the range of x values.

- Next, we must find the mean of the x variable. We can use the
AVERAGEfunction to find this mean.

- We can use the
DEVSQto find our SS statistic.

- We can find the leverage of each observation using the formula
=1/$I$1+(A2-$I$2)^2/$I$3.
- After calculating the leverage, we can now determine the standardized residuals. We’ll use the formula
=D2/(16.3545*SQRT(1-E2))to find the standardized residual of the first observation.

Frequently Asked Questions (FAQ)
Here are some frequently asked questions about this topic:
- Should I use standardized residuals over residuals?
The standardized residual can be more useful than the residual in most cases.
As the name implies, the standardized residual is a standardized measure of the deviation of each data point from the regression line. The value is expressed as a number of standard deviations away from the regression line. This properly allows us to easily compare across different models and datasets and can easily reveal which data points are outliers. - How do standardized residuals help find outliers?
Since standardized residuals present residuals in terms of standard deviations, we can use these values to find outliers. While it can vary in different contexts, a commonly used rule of thumb is that any data point that lies more than 2 or 3 standard deviations away from the mean could be considered an outlier.
This tutorial should cover everything you need to know about calculating standardized residuals of your regression model.
We’ve explained how to use a combination of different Excel functions to find key statistics, such as the leverage and residuals.
The standardized residual is just one example of a statistic you can find using Excel. For example, you can also look into our guide on how to perform a partial F-test to determine the significance of a particular set of variables on the model.
You may also check our guide on how the DEVSQ function works to know more about why this particular statistic is important.
That’s all for this step-by-step tutorial! If you’re still looking to learn more about Microsoft Excel, be sure to check out our library of Excel resources, tips, and tricks!


