

This guide will explain how to use the DEVSQ function in Excel.
We can use the DEVSQ function to return the sum of the squared deviations of all data points from the population’s sample mean.
The rules for using the DEVSQ function in Excel are as follows:
- The function requires one or more numerical arguments
- The function then outputs a numerical value equal to the sum of squared deviations of the dataset.
Let’s take a look at a quick example of where we can use the DEVSQ function.
Suppose you have a sample of 100 values from a population. We want to know the dataset’s variance. The variance will help us determine the spread between numbers in a data set.
Variance is a vital statistic because it measures the degree of dispersion of data around the sample’s mean. We can obtain the variance by dividing the sum of squared deviations (SS) by n-1, where n is the sample size.
The sum of squared deviations is determined by the following formula:
Σ(xi – x)^2
The value xi refers to the ith data value in the dataset. The variable x refers to the sample mean of your data.
How can we get the sum of squared deviations in Excel?
With the DEVSQ function, we can specify our sample data and determine the SS value for determining the variance.
Now that we know when to use the DEVSQ function, let’s learn how to use it and work on an actual sample spreadsheet.
The Anatomy of the DEVSQ Function
The syntax of the DEVSQ function is as follows:
=DEVSQ(number1, [number2], ...)
Let’s look at each term to understand what they mean.
- = the equal sign is how we start any function in Excel.
- DEVSQ() is our
DEVSQfunction. This function calculates the sum of squared deviations from the sample mean. - number1 and [number2] refer to the one or more numerical arguments the
DEVSQfunction can accept. - Instead of separating each argument with a comma, you may reference a cell range.
A Real Example of Using DEVSQ Function in Excel
The following section provides several examples of how to use the DEVSQ function. We will also explain the formulas and tools used in these examples.
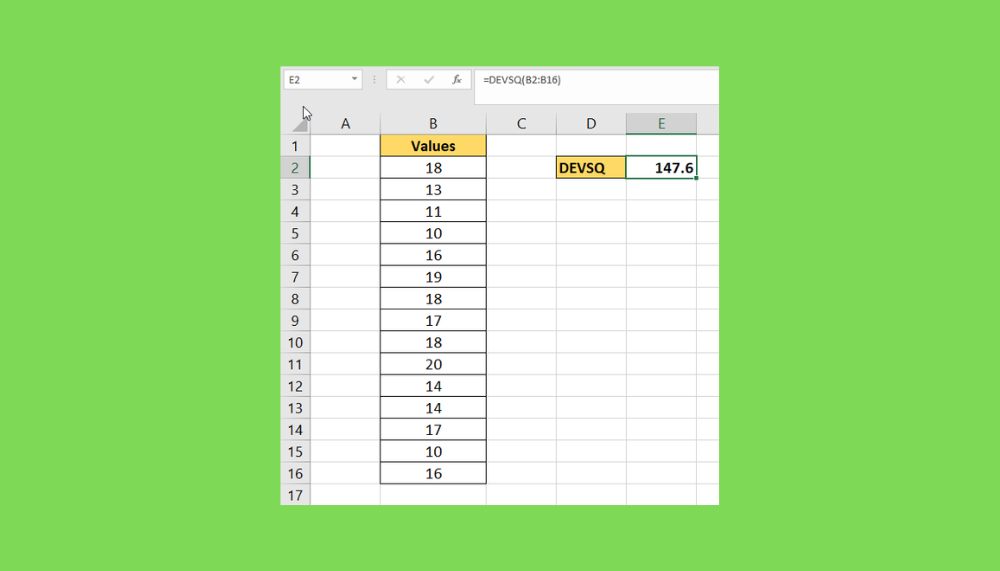
First, let’s take a look at our sample dataset. We have a table with 15 values taken randomly from a larger population.

We can use the DEVSQ function to determine the sum of squared deviations of the cell range B2:B16. In this example, the sum of squared deviations is 147.6.

We can divide this result by our sample size N to find the sample variance.

In this second example, our sample data consists of the same value. Computing the DEVSQ and variance metrics will lead to a value of 0. This should be the case since each data point is equal to the mean itself.

Do you want to take a closer look at our examples? You can make your own copy of the spreadsheet above using the link attached below.
Use our sample spreadsheet to see how the DEVSQ function output changes given different values in your dataset.
If you’re ready to try out the DEVSQ function in Excel, head over to the next section to read our step-by-step breakdown on how to do it!
How to Use DEVSQ Function in Excel
This section will guide you through each step needed to start using the DEVSQ function. You’ll learn how to use this statistical function to compute the variance of a sample population.
Follow these steps to start using the DEVSQ function:
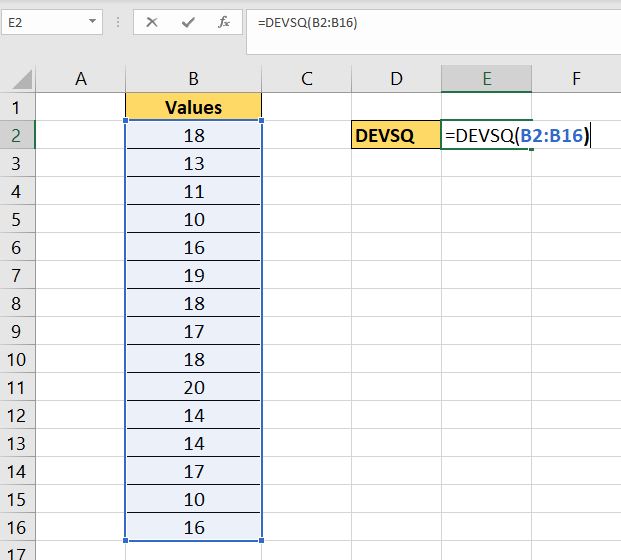
- First, select the cell that will compute the sum of squared deviations. In this example, we will use cell E2.

- Type ‘=DEVSQ(‘ into the formula bar to start the
DEVSQfunction.

- Add the cell range you want to measure as the argument of the
DEVSQfunction.
- Hit the Enter key to evaluate the
DEVSQfunction.
- We can find the variance of the same range by dividing the result of the
DEVSQfunction by the sample size. We can find the sample size through theCOUNTfunction.
Frequently Asked Questions (FAQ)
- What is the difference between DEVSQ and VAR?
Both of these functions calculate the sum of squared deviations from the mean. However, theVARfunction divides the result by either N or N-1. TheDEVSQfunction will only compute for the SS or sum of squared deviations.
This step-by-step guide should provide you with all the necessary information to begin using the DEVSQ function.
You should now have a clearer understanding of how the DEVSQ function works. You’ve also seen how you can use it to derive other statistical values, such as the variance of a sample population.
The DEVSQ function is just one example of the many Excel functions you can use in your spreadsheets. Our website offers hundreds of other functions and methods to help you get more out of Microsoft Excel.
With so many other Excel functions available, you can find one appropriate for your use case.
Don’t miss out on our team’s new spreadsheet tips, tricks, and best practices. Subscribe to our newsletter to stay updated on the latest guides from us!


