


This guide will explain how to calculate the interquartile range in Excel.
The interquartile range is a measure of dispersion. We can find this range by calculating the difference between the lower and upper quartiles of our sample.
How do we define the interquartile range? We can divide our dataset into two halves based on the median. The median of the upper half is considered the upper quartile. Meanwhile, the median of the lower half will be our lower quartile.
This measure can help you find the spread of your dataset. The benefit of calculating the interquartile range is that it is not affected by outliers. Outliers may skew the data and provide an inaccurate summary of the entire population.
Let’s take a look at a sample scenario where we can benefit from calculating the interquartile range.
Suppose you have a dataset of patient heights. You want to determine the difference between the spread of male and female patients.
We can use the interquartile range to measure the spread of the middle half of our data. We can use this measurement along with other metrics, such as the median, to form a better analysis of our sample populations.
The QUARTILE function in Excel will be used to return the first and third quartiles. We’ll compute the difference between these two values to find the interquartile range for both the male and female samples.
Now that we know that we can use the interquartile range to measure the spread of data, let’s explore an actual sample spreadsheet.
A Real Example of Calculating the Interquartile Range in Excel
The following section provides several examples of how to use this function. We will also go into detail about the formulas and tools used in these examples.
First, let’s take a look at the sample dataset we’ll need to analyze.
Our table consists of a random sample of 30 patients. Each patient has a recorded height measured in centimeters.

We’ll use the QUARTILE function to return the range’s 1st and 3rd Quartile. These values are equivalent to the 25th and 75th percentile, respectively.

To get the 1st QUARTILE in Column C, we just need to use the following formula:
=QUARTILE(B2:B31,1)
We can replace 1 with 3 to return the 3rd quartile instead.
Microsoft Excel comes with an alternative quartile function called .
We can use the QUARTILE.EXC function if we want to compute for a wider interquartile range with fewer outliers.

Do you want to take a closer look at our examples? You can make your own copy of the spreadsheet above using the link attached below.
If you’re ready to calculate the IQR yourself, head over to the next section to read our step-by-step breakdown on how to do it!
How to Calculate the Interquartile Range in Excel
This section will guide you through each step needed to calculate the interquartile range in Excel. You’ll learn how to use the QUARTILE function to determine the 1st and 3rd quartile of a given sample population. We’ll find the difference between these values to find the interquartile range.
Follow these steps to calculate the interquartile range in Excel:
- First, select the cell that will compute the first quartile of the given population. In this example, we’ll place the
QUARTILEfunction in cell E2.
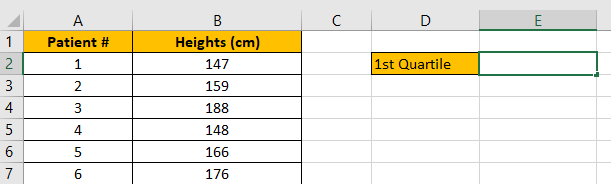
- Next, type in the
QUARTILEfunction in the formula bar. The first argument is a cell reference to the range that holds the sample population. We’ll input ‘1’ as our second argument to indicate that we want to return the first quartile or 25th percentile.
 Hit the Enter key to evaluate the function.
 - Select the cell that will compute the third quartile of the given population. In this sheet, w will add the second
QUARTILEfunction in cell E3.
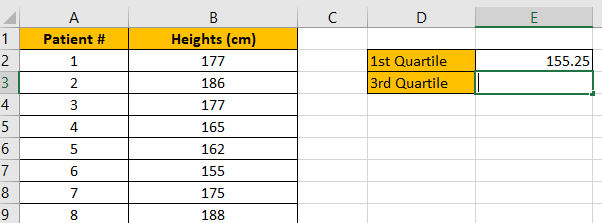
- Type ‘3’ into the second argument of the
QUARTILEfunction to indicate that we want to return the 3rd quartile.

- Next, we’ll select another cell and write a formula to find the difference between the first and third quartiles. In this example, we’ll find the difference by subtracting E2 from E3.

- Hit the Enter key to return the final result.
These are all the steps you need to calculate the interquartile range in Excel.
This step-by-step guide should provide you with all the information you need to calculate the interquartile range in Excel.
The interquartile range is a useful metric that tells you how to spread out your data is at a glance.
The quartile function is just one example of the many Excel functions you can use in your spreadsheets. Our website offers hundreds of other functions and methods to help you get more out of Microsoft Excel.
For example, you can read our article on univariate analysis in Excel to learn more about other summary statistics you can derive with Excel functions.
With so many other Excel functions available, you can find one appropriate for your use case.
Don’t miss out on our team’s new spreadsheet tips, tricks, and best practices. Subscribe to our newsletter to stay updated on the latest guides from us!


