This guide will explain how to create a two-factor ANOVA analysis without replication in Excel.
This type of analysis will allow you to compare groups based on two different variables.
We can use an ANOVA or analysis of variance test to assess the difference between the means of different groups.
The main goal of an ANOVA test is to determine whether the researcher can reject the null hypothesis for the analysis. Rejecting the null hypothesis will indicate that there is a statistically significant difference between the two groups being compared.
This guide will focus on a specific type of ANOVA analysis that handles two nominal variables without replication.
Let’s take a look at a simple example that will help illustrate when to use this type of analysis.
Suppose you have an agricultural dataset that contains how quickly different crops grow. We want to know how the crop type and fertilizer used affect the growth rate.
Since we’re looking at two different variables, we can perform a two-factor ANOVA analysis on the dataset.
Excel includes the Analysis Toolpak add-in that can generate over a dozen different statistical techniques. We’ll use this tool to generate an ANOVA table from our dataset.
Let’s take a look at a real example of a two-factor ANOVA without replication in Excel.
A Real Example of Using ANOVA Two Factor Without Replication in Excel
The following section provides a real example of using the Analysis Toolpak to generate an ANOVA table. We will also go into detail about the formulas and tools used in these examples.
First, let’s take a look at the dataset we’ll be looking into with our statistical tool. The table below shows the average amount of time in hours for a certain crop to grow, given a specific type of fertilizer.

We want to determine whether the fertilizer used affects how fast the plant grows. We also want to know if there is a significant difference in growth rate between the different plant varieties.
We’ll use the Analysis Toolpak to create our ANOVA table. The rows refer to the plant varieties, and the columns refer to our fertilizer types.

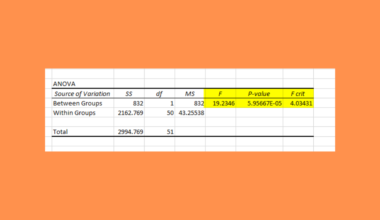
The researcher can compare the F value and the F critical value to determine whether we should reject the null hypothesis.
We can conclude that the plant variety has no significant effect on growth rate. We can also conclude that the fertilizer used does have a significant effect on the growth rate.
Do you want to take a closer look at our examples? You can make your own copy of the spreadsheet above using the link attached below.
Do you want to try using the Analysis Toolpak add-in to set up your own two-factor ANOVA table? Continue reading and follow our step-by-step guide on how to do it!
How to Use ANOVA Two Factor Without Replication in Excel
This section will guide you through each step of setting up a two-factor ANOVA table without replication.
Follow these steps to start using the Analysis Toolpak add-in:
- First, we must enable the Analysis Toolpak add-in in our Excel application. Click on the File tab to access the Excel Options menu.

- Click the Options button in the screen’s bottom-left corner.

- In the Excel Options dialog box, click the Add-ins tab and select the Go button.

- Ensure that the Analysis Toolpak option in the list of available add-ins is checked. Click on OK to enable the selected add-in.

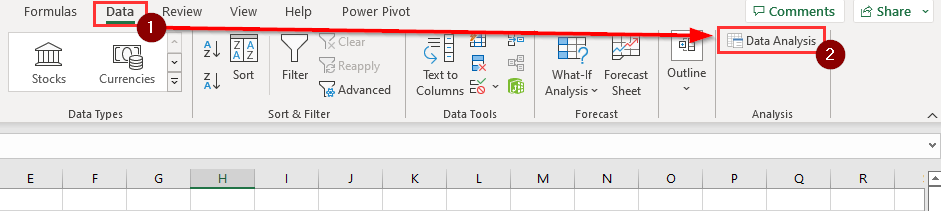
- You can now find the Data Analysis tool in the Data tab. Click on the tool to create an ANOVA table in your worksheet.
- In the Data Analysis dialog box, select the Anova: Two-Factor Without Replication option. Click on OK.

- The user must specify the input range that holds the variable data. Indicate whether the input range includes labels.
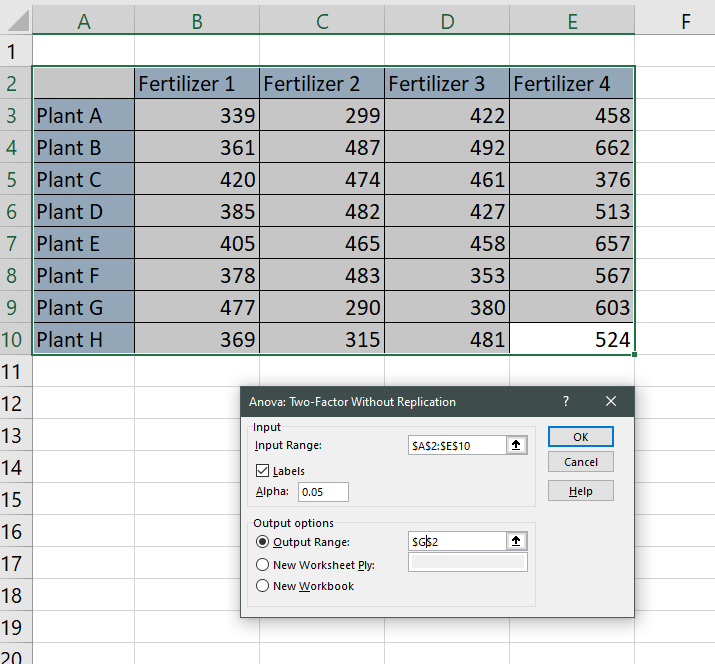 Next, we must specify the alpha for the analysis. In this example, we’ll use the standard value of 0.05 as our alpha or threshold for significance. We must also select the ANOVA table’s output range. You may also choose to output the table in a new worksheet or workbook.
 - The generated ANOVA table should now have the statistical values you need to conclude whether to reject the null hypothesis or not.
These are all the steps you need to follow to perform a two-factor ANOVA without replication in Microsoft Excel.
Frequently Asked Questions (FAQ)
- How does the ANOVA calculate statistical significance?
The ANOVA table shows a calculation of the F statistic. This value is computed as the ratio of the mean sum of squares to the mean square error. A high enough F statistic should indicate that the difference among groups is statistically significant. - When should I use a two-factor ANOVA and a one-factor ANOVA?
The main difference between these two types of analysis is the number of independent variables. For example, if we want to test the effect of gender on height, we’ll only need to use the one-factor ANOVA. However, we’ll need to use the two-way ANOVA if we want to find the relationship between gender, nutrition, and a person’s height.
This step-by-step guide should provide you with all the information you need to perform an ANOVA analysis on your dataset.
We’ve provided a detailed example that you can explore to learn more about two-factor ANOVA analysis without replication. We’ve shown how you can use the Analysis Toolpak to set up the table in a few simple steps.
The ANOVA table is just one example of the many Excel functions you can use in your spreadsheets. Our website offers hundreds of other functions and methods to help you get more out of Microsoft Excel.
For example, you can read our guide on how to perform an ANOVA analysis on a randomized block design dataset. With so many other Excel functions available, you can find one appropriate for your use case.
Don’t miss out on our team’s new spreadsheet tips, tricks, and best practices. Subscribe to our newsletter to stay updated on the latest guides from us!