

This guide will explain how to calculate the standard error of regression in excel.
The main objective of regression is to identify the relationship between dependent and independent variables from a given dataset. Regression analysis hopes to create an accurate model that we can use to predict future or unknown values.
However, there are cases where a regression model may not fit our data precisely. One technique to determine the precision of a model is through calculating the standard error of regression.
The standard error of regression measures the precision of the estimated regression coefficients. If the standard error of regression is too large, we can conclude that the coefficients used may not be a good estimate of the true relationship between variables.
On the other hand, a smaller standard error of regression indicates that the regression coefficients are more likely to precisely model the relationship between our variables.
The Analysis ToolPak is an Excel add-in that provides a set of advanced data analysis tools for statistical and engineering analysis. We can use the add-in’s Regression tool to perform linear regression analysis on our data quickly.
In this guide, we will provide a step-by-step tutorial on how to find the standard error of regression given a dataset of independent and dependent variables. We will cover how to use the Analysis Toolpak add-in to find the standard error.
Let’s dive right in!
A Real Example of Calculating the Standard Error of Regression in Excel
Let’s explore a simple example where we will need to find the standard error of regression.
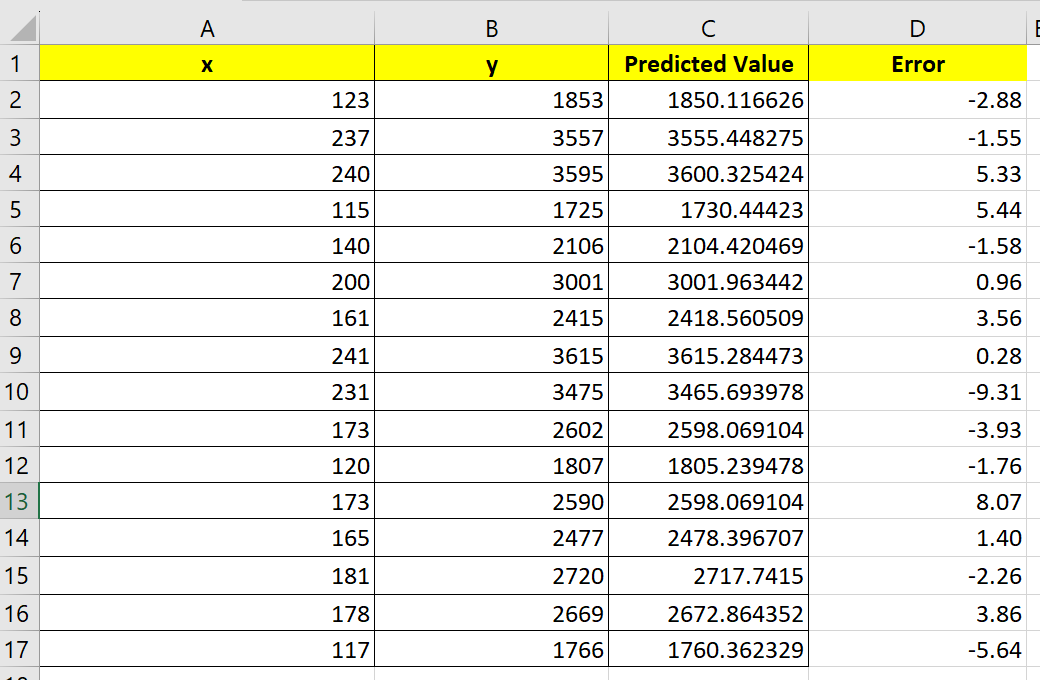
In the table seen below, we have an independent variable x and a dependent variable y.

Using regression analysis, we were able to find the following linear regression equation:
y = 14.96x + 10.15
We want to assess whether the equation above is precise enough to predict future values.
The standard error of regression (S) is a popular goodness-of-fit test that can determine the precision of our model.
We can find S using the following equation:
sqrt [ Σ(yi – ŷi)^2 / (n – 2) ]
Let’s try to understand the equation above.
The yi variable refers to the observed value of the dependent variable, and the ŷi variable refers to the predicted value found through the linear equation. We want to find the sum (Σ) of the squares of the differences between the y and ŷ variables.
After obtaining the sum, we must divide the total by n – 2, where n is the number of observations. We must then find the square root of the resulting quotient to determine the standard error of regression.

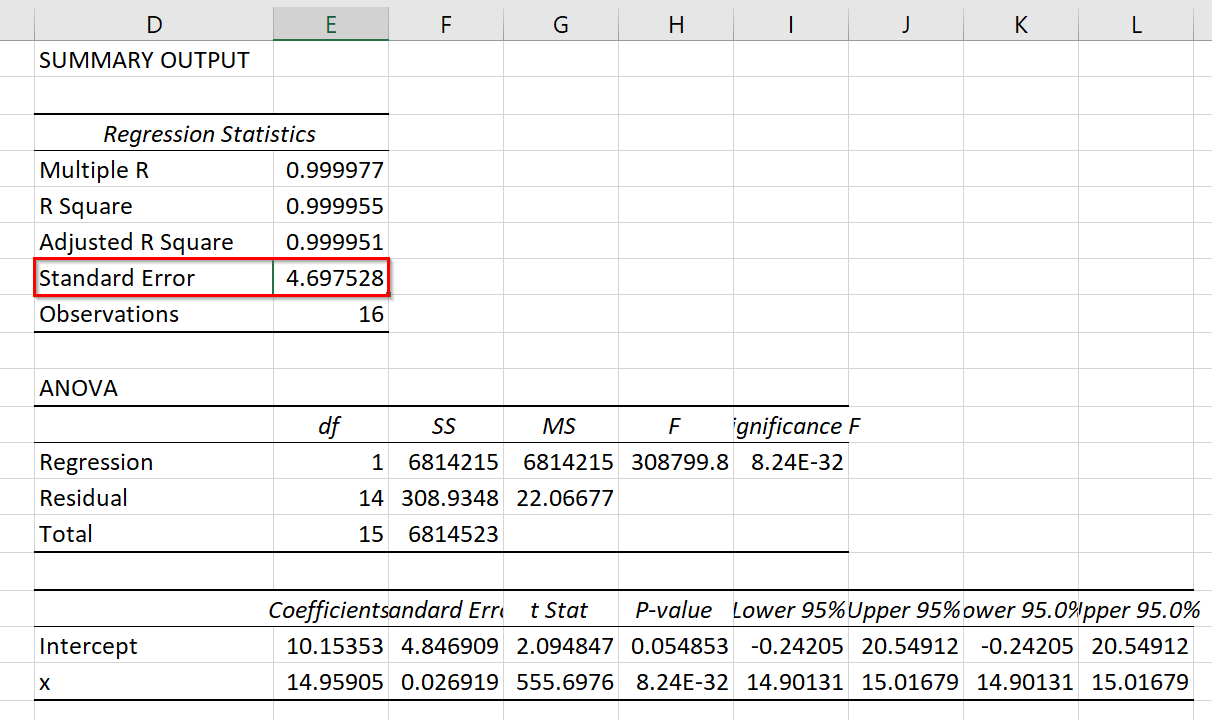
If we were to use the Regression tool that comes with the Analysis Toolpak add-in, the tool will generate the standard error as part of the summary output.
Do you want to take a closer look at our examples? You can make your own copy of the spreadsheet above using the link attached below.
If you’re ready to calculate the standard error of regression in Excel, head over to the next section to read our step-by-step breakdown on how to do it!
How To Calculate Standard Error Of Regression In Excel
This section will guide you through each step needed to calculate the standard error of regression in Excel.
Follow these steps to start looking for the standard error of regression:
-
- First, we’ll have to ensure that the Analysis Toolpak add-in is activated in our Excel program.
In the File tab, click on Options to display the Excel Options dialog box.

Head over to the Add-ins tab and click on the button labeled ‘Go…’ to proceed. - Check the option labeled ‘Analysis ToolPak’ and click on OK.

- Next, head over to the Data tab and click on the Data Analysis option.

- Select the “Regression” tool and click on OK.

- In the Regression dialog box, fill out the Input X Range and Input Y Range. You must also indicate the output range where the summary output will be generated. Click on OK to generate the summary output of the regression.

- Under the Regression Statistics table, you can find the standard error of the regression model.
The summary output also provides the standard error for each coefficient in the regression model.
- Given the coefficients of our regression model, we can also find the standard error of regression using Excel formulas.
First, we’ll need to find the predicted value of each observation. We’ll multiply each independent variable with the corresponding coefficient and add up all the terms.
- We’ll use the AutoFill tool to find the predicted y value for each observation.

- We can find the error of each observation by calculating the difference of the observed y value and the predicted y value.
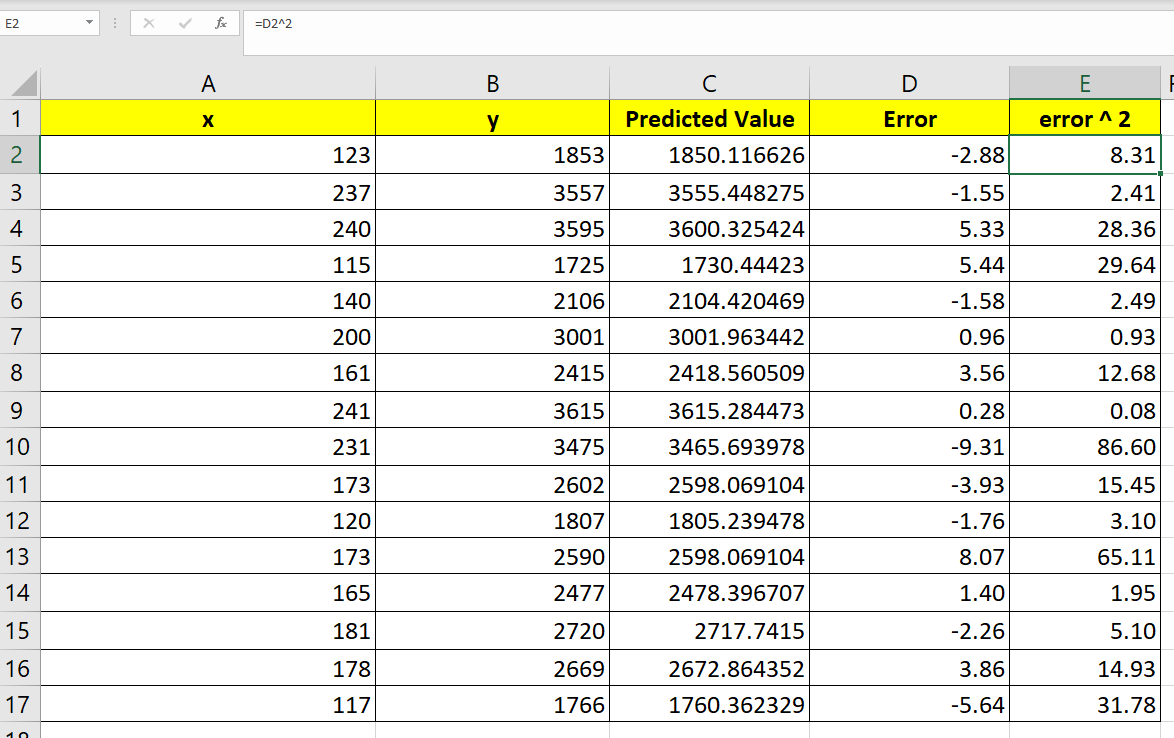
- Next, we’ll need to calculate the square of each error.
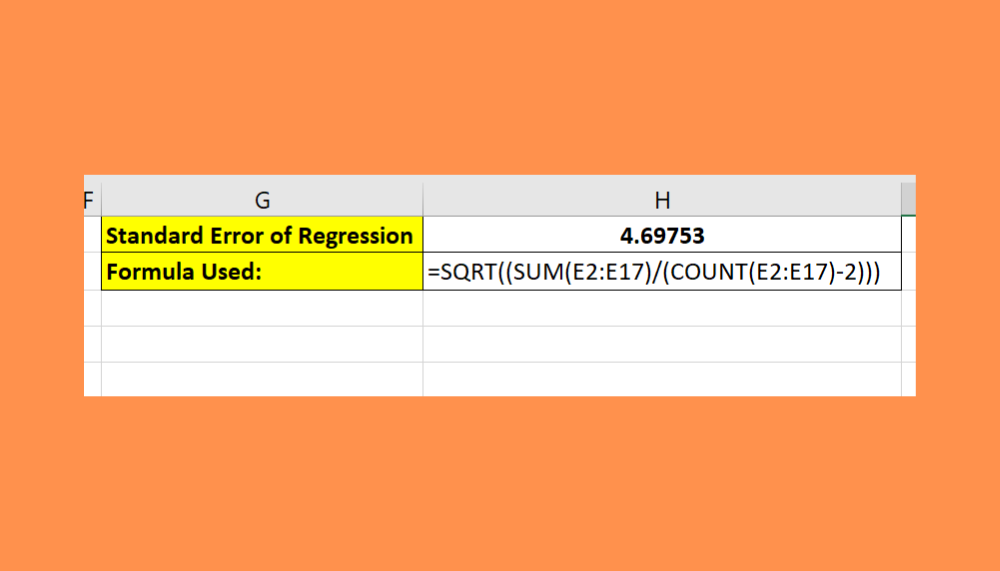
- We’ll use the formula
=SQRT((SUM(E2:E17)/(COUNT(E2:E17)-2)))to find the standard error of regression given the values calculated in the previous step.
In our example, we’ve determined that the standard error of regression for our model is about 4.7.
- First, we’ll have to ensure that the Analysis Toolpak add-in is activated in our Excel program.
Frequently Asked Questions (FAQ)
Here are some frequently asked questions about this topic:
- How do you interpret the resulting standard error of regression?
The standard error of the regression indicates how far the observed values are from the regression line. A higher standard error of regression will indicate that a larger number of predictions fall outside the established prediction interval. - What is the difference between the standard error of regression and the R-squared value?
The standard error of regression measures the precision of the estimated regression coefficients, while R-squared measures the goodness of fit of the regression model as a percentage. The standard error is more helpful in cases where you need to assess the precision of the model using the actual units of the variables.
We’ve explained how to use the Analysis Toolpak add-in to find the standard error of regression. We’ve also covered how to find the standard error of regression yourself given the linear equation of the regression.
Calculating the standard error of regression is just one way you can test the goodness of fit of your model.
For example, another statistic you can use is the mean squared error or MSE. You can read our step-by-step guide on how to find the mean squared error in Excel.
You may also check our guide on how to perform multiple linear regression in Microsoft Excel to know more about the Regression tool.
That’s all for this guide on finding the standard error of regression! If you’re still looking to learn more about Microsoft Excel, be sure to check out our library of Excel resources, tips, and tricks!


