


This guide will explain how to create a sensitivity report from the Solver tool in Excel.
Sensitivity reports are useful in linear programming problems that require you to find the optimal solution given specific variables that can be changed.
The sensitivity report shows how changes in specific coefficients in a function affect the solution. The report is a type of What-If analysis that focuses on predicting the outcome of a specific action or set of actions.
Let’s take a look at a quick example of where we might benefit from a sensitivity report.
Suppose you want to start a business selling fruit. You plan on having three types of fruit for sale: Apples, Papayas, and Watermelons.
Selling an apple will generate $2.50 in profit, a papaya will generate $3.00 in profit, and a watermelon will net $5.00 in profit.
However, each of these fruit products has a certain cost. First, the business owner must consider the capital necessary to purchase the fruits from the supplier.
Next, the seller must consider how much storage is necessary. For example, our storage room may be large enough to hold 10 watermelons. However, the same amount of space could hold 40 apples or 20 papayas.
If we want to maximize profits, we’ll also have to consider our constraints for both capital and storage. We’ll generate a sensitivity report to determine the optimal changes to our current values.
How can we do this in Excel?
Excel includes an add-in called Solver that can help us find the optimal solution within the bounds of our constraints.
Now that we have an idea of when to create a sensitivity report with Solver, let’s take a look at a sample spreadsheet with a sensitivity report.
A Real Example of Creating a Sensitivity Report from Solver in Excel
The following section provides several examples of how to use this function. We will also go into detail about the formulas and tools used in these examples.
First, let’s take a look at a sample spreadsheet that involves values we want to optimize.
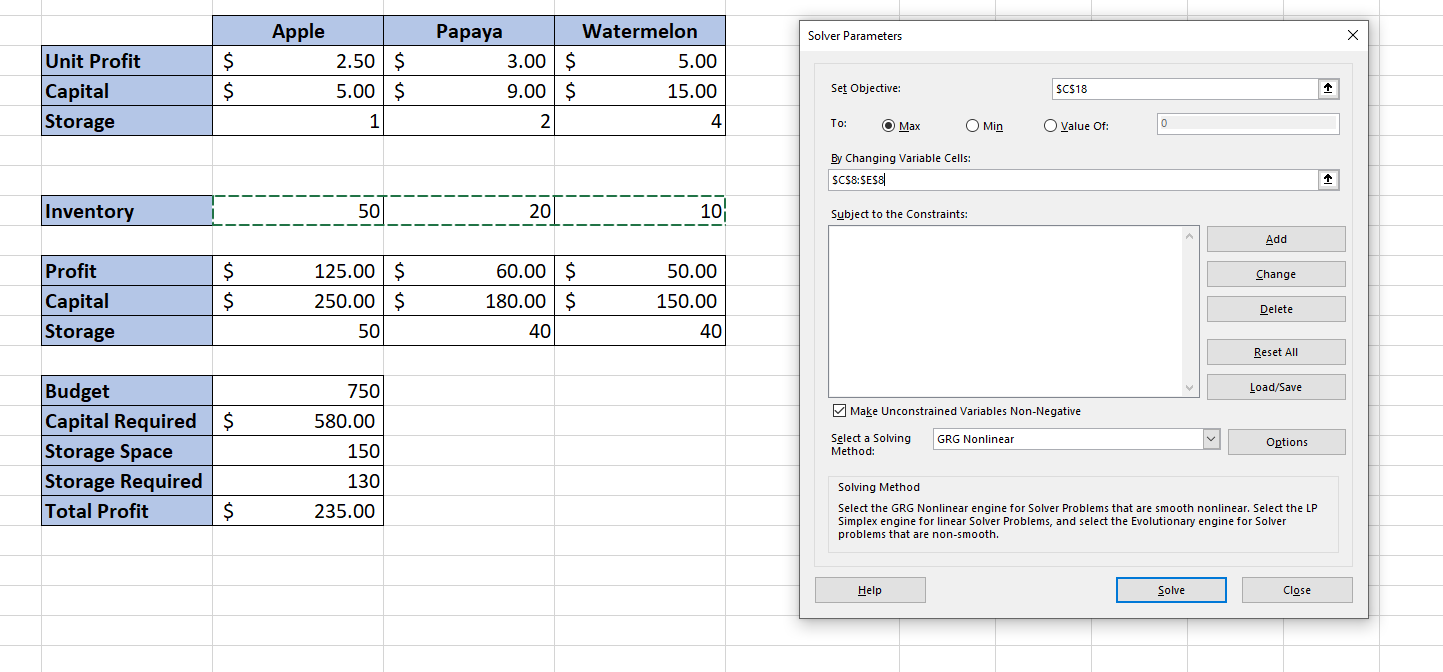
The spreadsheet below aims to compute the amount of profit the business owner will earn based on how much of each fruit option is added to the inventory.

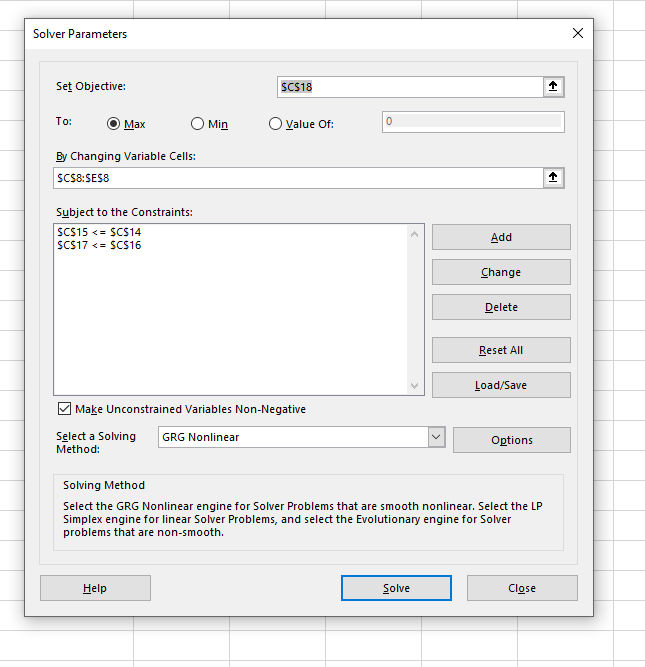
In this spreadsheet, we want to modify the cell range C8:E8 to maximize cell C18. We also want to ensure that the constraints indicated in cells C15 and C17 are followed.
We can use the Solver add-in to create a sensitivity report. Based on the generated report, we’ll need to stock up on 150 apples to maximize our profits.
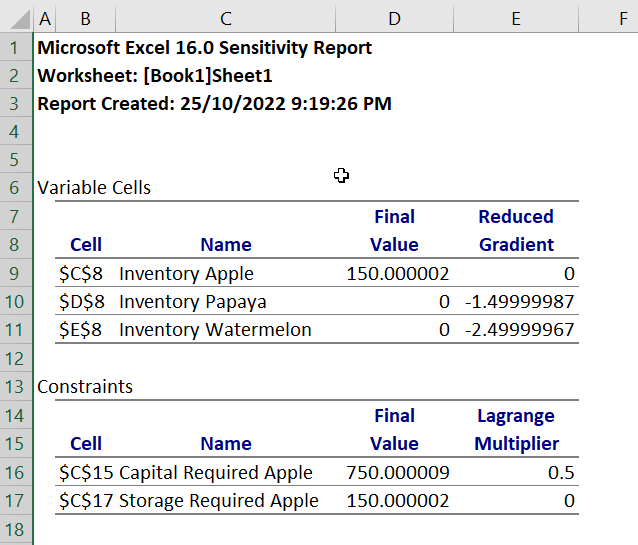
The sensitivity report also confirms that both our constraints have been followed.
Do you want to take a closer look at our examples? You can make your own copy of the spreadsheet above using the link attached below.
Use our sample spreadsheet to take a closer look at the formulas we’ve used in the initial spreadsheet.
If you’re ready to try out the Solver add-in yourself, head over to the next section to read our step-by-step breakdown on how to do it!
How to Create a Sensitivity Report from Solver in Excel
This section will guide you through each step needed to generate a sensitivity report from the Solver add-in in Excel. We’ll explain how we set up our spreadsheet to enable the Solver tool to optimize a specified cell by modifying a select range of cells.
Follow these steps to create a sensitivity report using the Solver tool:
- First, we’ll have to set up our spreadsheet so that we have a formula to maximize. We also want to keep track of whether our constraints are met. In this example, we’ll start by adding the profit, capital, and storage of each of our fruit product options.

- Next, we’ll compute how these values change depending on how much the business owner adds to the business. We’ll multiply each metric with the inventory number in row 8.
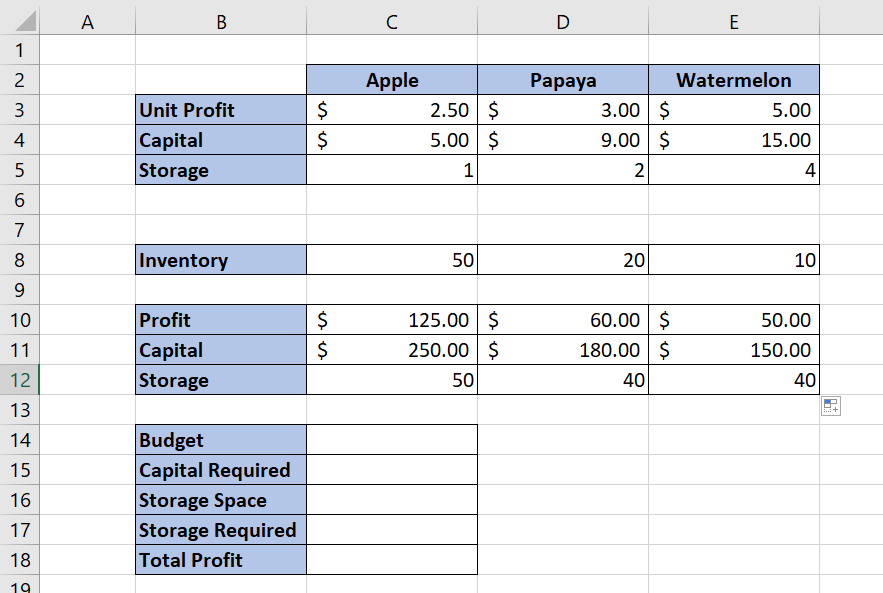
- Next, we’ll add our constraints in cells C14 and C16. Cells C15 and C17 will keep track of the total capital and storage required given the chosen inventory distribution. Lastly, we’ll compute the total profit in C18 by finding the sum of the range C10:E10.
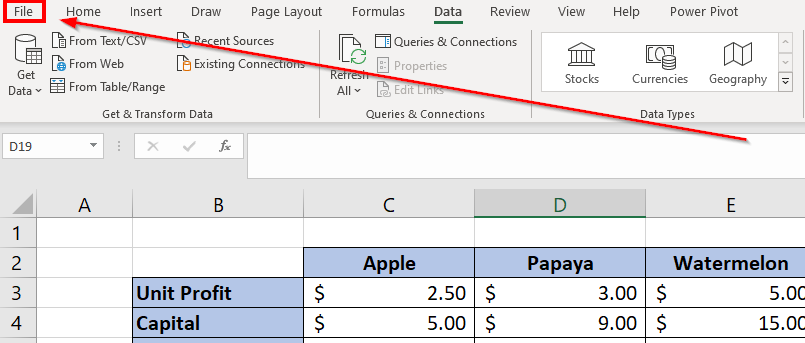
- Next, we’ll have to access the Solver add-in to create our sensitivity report. Navigate to the File tab and click on Options.
- In the Excel Options dialog box, head to the Add-ins tab and click on Go.

- Ensure that the Solver Add-in option is checked. Click on OK.

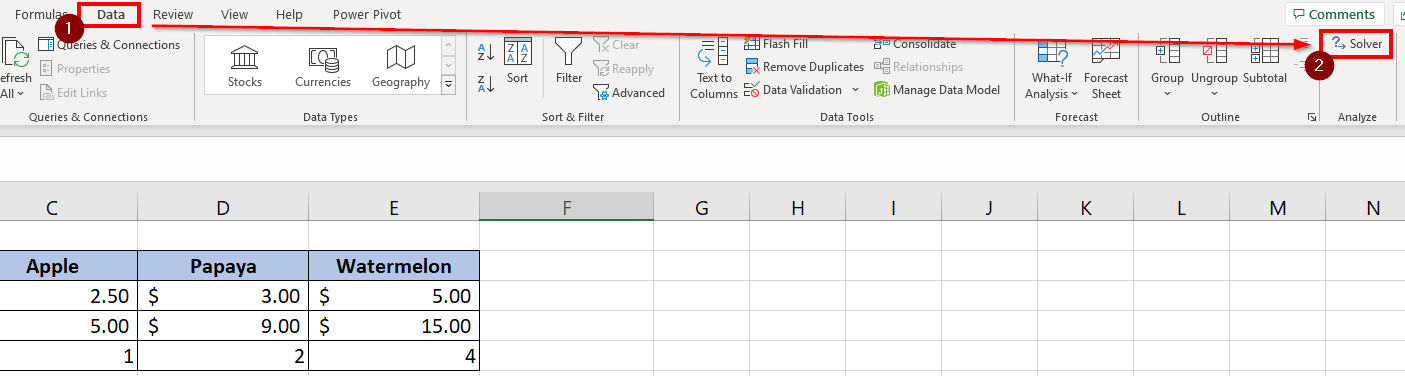
- In the Data tab, click on the Solver option to access the Solver Parameters dialog box.
- Select the cell you want to optimize in the text box labeled ‘Set Objective’. Select whether you want to maximize or minimize this value. Next, indicate which cells you want the Solver add-in to change to achieve this.
- Next, click on the Add button to add a new constraint. In this example, we’ll first add the constraint that the capital required should not be higher than the proposed budget.

- Ensure that all the constraints in your problem have been added to the Solver add-in. Click on Solve.
- In the Solver Results dialog box, click on the Sensitivity option under Reports. Click on OK to generate the sensitivity report in a new sheet.

- You should now have a sensitivity report for your optimization problem.
This step-by-step guide is a quick introduction to using the Solver add-in to create a sensitivity report for values you want to optimize.
Creating sensitivity reports is just one example of the many Excel functions you can use in your spreadsheets. Our website offers hundreds of other functions and methods to help you get more out of Microsoft Excel.
With so many other Excel functions available, you can find one appropriate for your use case.
Don’t miss out on our team’s new spreadsheet tips, tricks, and best practices. Subscribe to our newsletter to stay updated on the latest guides from us!


