This guide will explain how to calculate a five-number summary in Excel.
The five-number summary gives the user a quick overview of their data set. The summary can help detect any outliers and give you a general idea of the distribution of your data.
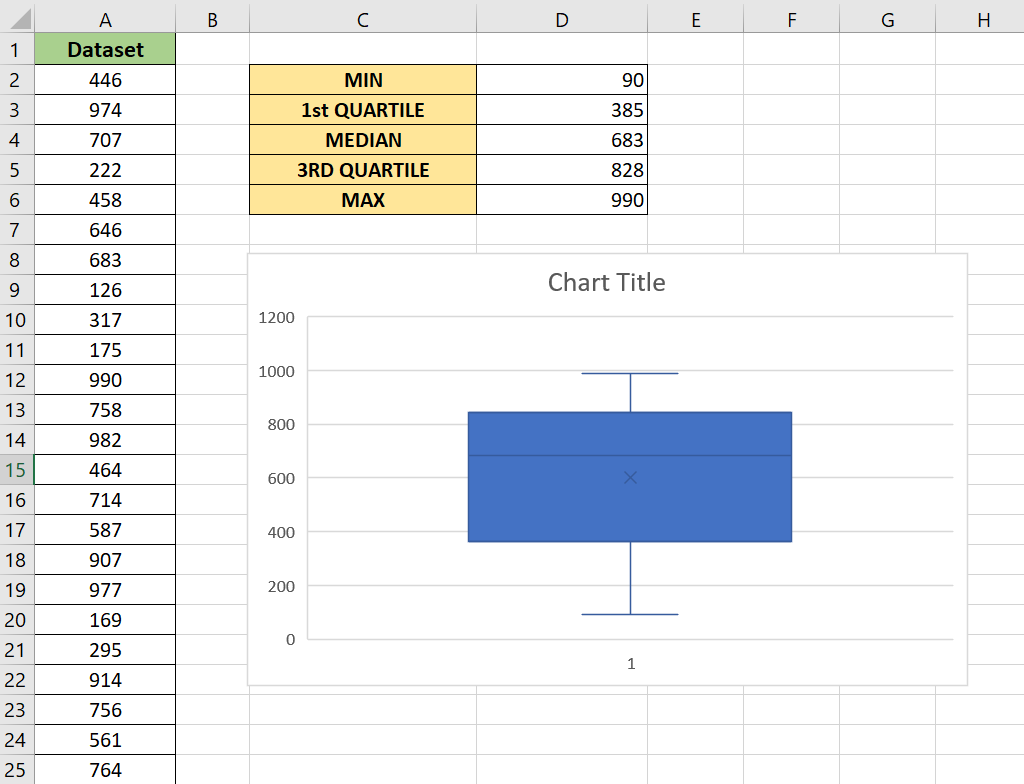
The five-number summary is a set of statistics that provides information about a data set. It includes the minimum value, the maximum value, the median, the first quartile, and the third quartile.
A quartile is a statistical term that refers to three points in our dataset that divide our numerical data into four quarters. Values that lie between the first and third quarters should make up around 50% of the entire dataset.
Let’s take a look at a simple example where we can calculate the five-number summary.
Suppose you have demographic data for a particular region. You want to know the age distribution across a sample of a thousand people.
We can use the five-number summary to get a quick data set overview. For example, use the five-number summary to understand the data distribution before you begin a more in-depth analysis.
Users may also use Excel’s Box and Whisker chart to create a boxplot that visualizes the five-number summary.
Now that we know when to use the five-number summary for data analytics, let’s see how this works on an actual sample spreadsheet.
A Real Example of Calculating a Five-Number Summary in Excel
The following section provides an example of using Excel formulas to find the five-number summary of a dataset. We will also go into detail about the formulas and tools used in these examples.
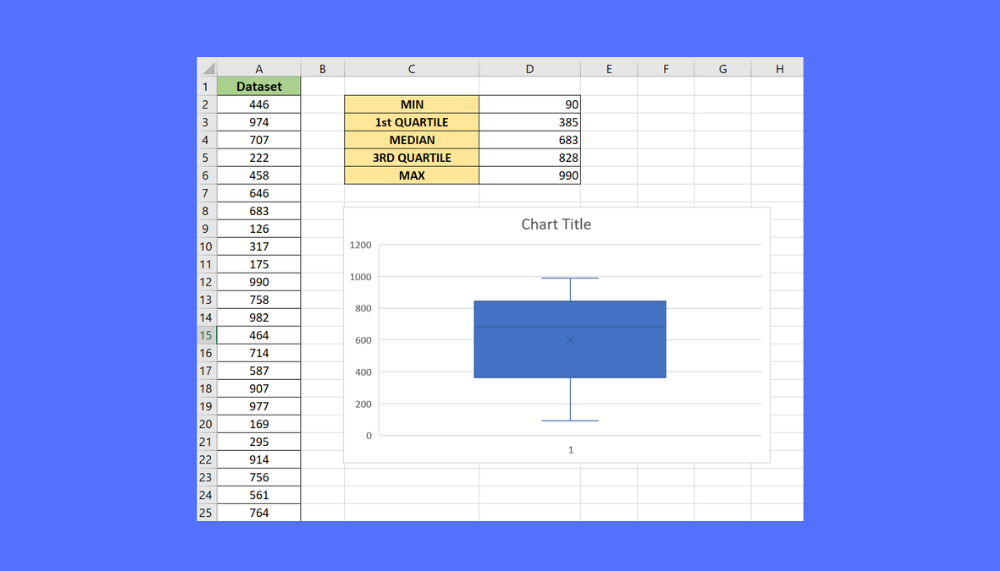
First, let’s take a look at a real example of how Excel functions can provide the five-number summary.
To get the lower and upper quartile, we’ll have to use the QUARTILE function:
=QUARTILE(A:A,1)
=QUARTILE(A:A,3)
The dataset’s median is determined by sorting the dataset in order and retrieving the middle value. We can find the median using the MEDIAN function:
=MEDIAN(A:A)
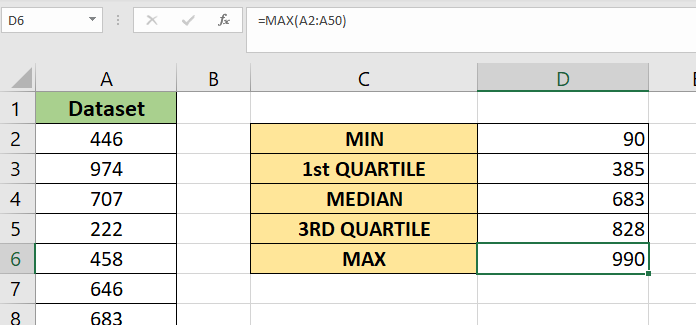
We’ll also use the MIN and MAX functions to find the smallest and largest values in the given dataset.
=MIN(A:A)
=MAX(A:A)
You may also use Excel’s Box and Whisker chart option to visualize the five-number summary better.
Do you want to take a closer look at our examples? You can make your own copy of the spreadsheet above using the link attached below.
If you’re ready to try calculating a five-number summary, head over to the next section to read our step-by-step breakdown on how to do it!
How to Calculate a Five-Number Summary in Excel
This section will guide you through each step needed to calculate a five-number summary in Excel. You’ll learn how to use the MIN, MAX, QUARTILE, and MEDIAN functions.
Follow these steps to start using the five-number summary function:
- First, set up the table with labels for our five-number summary. We’ll need values for the minimum, first quartile, median, third quartile, and maximum.

- We’ll use the
MINfunction to get the smallest number in the dataset.
- Next, we’ll use the
QUARTILEfunction to retrieve the lower quartile. The first quartile is the middle number between the minimum value of the dataset and the median. We’ll add ‘1’ as our second argument to indicate that we wantQUARTILEto output the first quartile.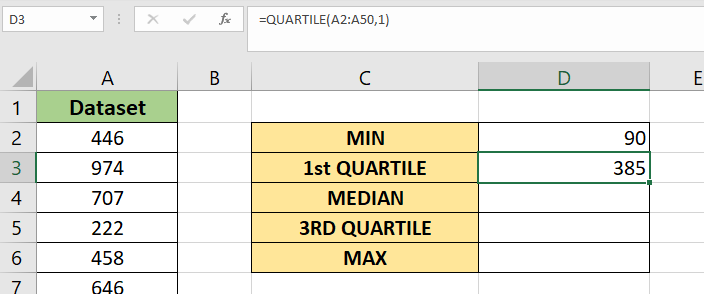
- We can determine the median of the dataset using the
MEDIANfunction.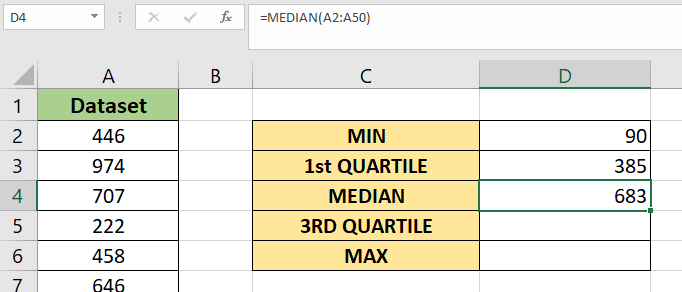
- Similar to what we’ve done with the lower quartile, we’ll use the
QUARTILEfunction to determine the upper quartile. The upper quartile is also known as the third quartile. This is why we must add ‘3’ as an argument to ourQUARTILEfunction.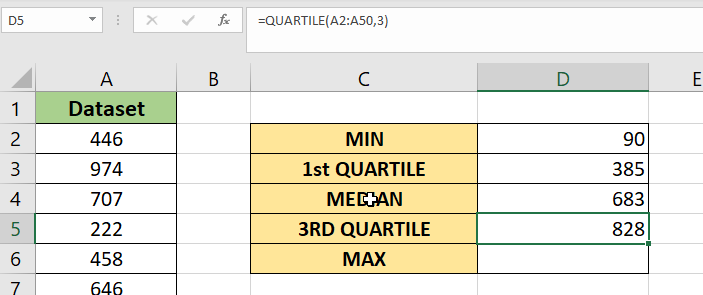
- We’ll use the
MAXfunction to retrieve the maximum value in our dataset. - We may also use the built-in Excel chart options to visualize our five-number summary. First, ensure that the entire dataset is selected.

- Next, navigate to the Insert tab and click on the Histogram icon. Under the drop-down list, select the option Box and Whisker.

- You should now have a visual representation of the five-number summary.
These are all the steps needed to both calculate and visualize the five-number summary of a dataset in Excel.
This step-by-step guide should provide you with all the information you need to calculate the five-number summary in Excel.
This summary is useful when performing a preliminary investigation of a large dataset. The values will indicate the central tendency and general shape of a distribution.
The five-number summary is just one example of the many Excel features you can use in your spreadsheets. Our website offers hundreds of other functions and methods to help you get more out of Microsoft Excel.
With so many other Excel functions available, you can find one appropriate for your use case.
Don’t miss out on our team’s new spreadsheet tips, tricks, and best practices. Subscribe to our newsletter to stay updated on the latest guides from us!