


This guide will explain how to create a covariance matrix in Excel.
The covariance matrix is a useful table for principal component analysis and for datasets with many dimensions.
The covariance matrix shows the distribution magnitude and direction of multivariate data. We can use the covariance matrix to find redundant variables to simplify your model.
Let’s take a look at a quick example of where we can benefit from creating a covariance matrix.
Suppose you have given a group of students an IQ test to understand how different types of areas of intelligence affect each other.
Each respondent has corresponding scores for each section of the IQ test. For example, a student may have a score of 90 in Logical Reasoning and an 85 in Working Memory.
We can generate a covariance matrix to determine whether any of these areas of intelligence covary positively with one another.
Excel’s Analysis Toolpak add-in will enable us to generate a covariance matrix in a few clicks. The tool only requires a range of data as input and will output a table showing the covariance for each possible pair of variables.
Now that we have an idea of when to use the covariance matrix, let’s learn how to use it and work on an actual sample spreadsheet.
A Real Example of a Covariance Matrix in Excel
The following section provides several examples of how to use this function. We will also go into detail about the formulas and tools used in these examples.
First, let’s take a look at our sample dataset. We have a table of 15 respondents and their corresponding scores in different sections of the IQ test.

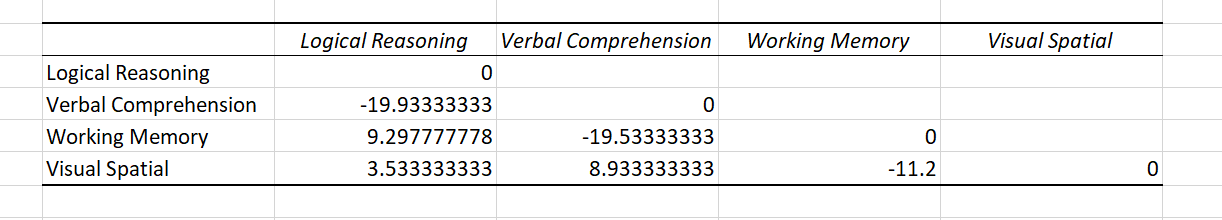
We can use the Analysis Toolpak to create a covariance matrix to see which variables tend to move together. In this example, we can see that working memory and logical reasoning covary positively, while verbal comprehension and logical reasoning have a negative covariance.
Do you want to take a closer look at our examples? You can make your own copy of the spreadsheet above using the link attached below.
If you’re ready to try out the covariance matrix, head over to the next section to read our step-by-step breakdown on how to do it!
How to Create a Covariance Matrix in Excel
This section will guide you through each step needed to generate a covariance matrix in your Excel spreadsheet. You’ll learn how to add the Analysis Toolpak to your Excel application and use one of the available tools to calculate the covariance among a set of variables.
- First, we must add the Analysis Toolpak add-in to our Excel application. Click on the File tab to access the Excel Options menu.

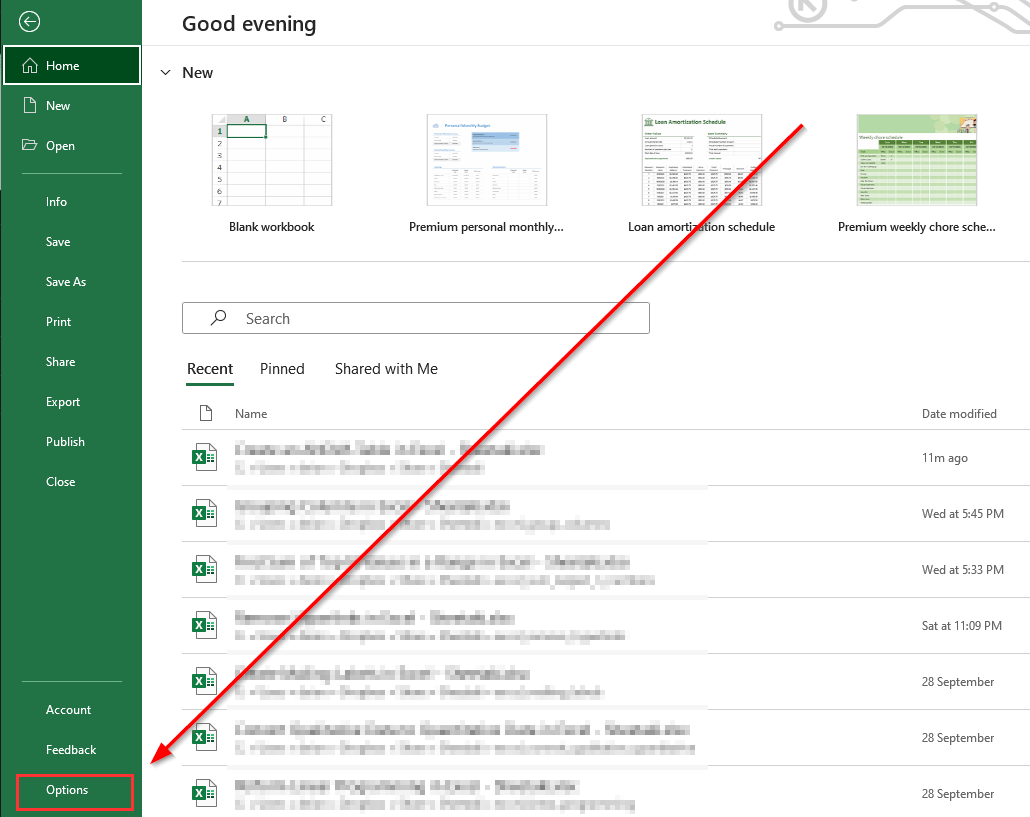
- Click the Options button in the screen’s bottom-left corner.
- In the Excel Options dialog box, click on the Add-ins tab and select the button labeled ‘Go’.
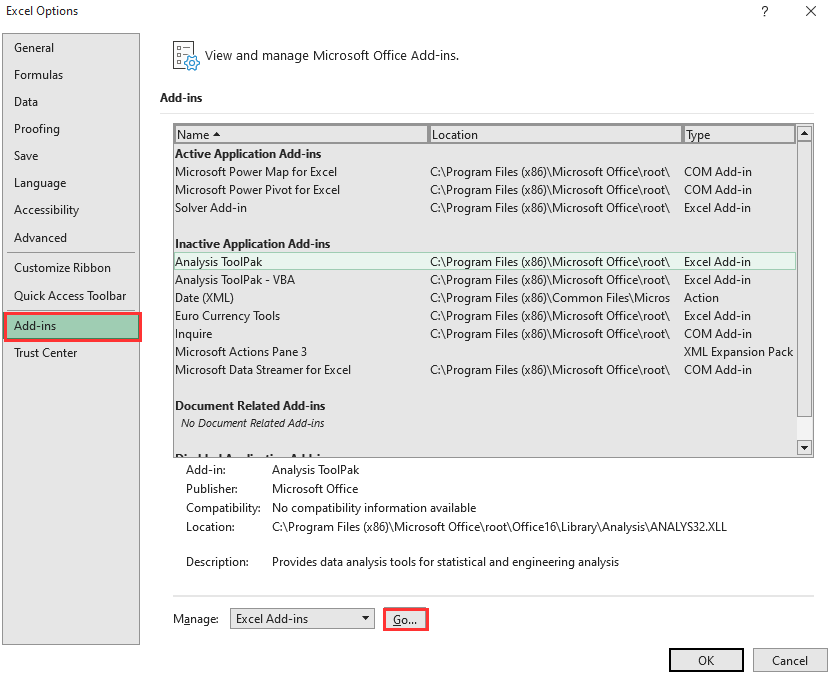
- Ensure that the Analysis Toolpak option in the list of available add-ins is checked. Click on OK to enable the selected add-in.

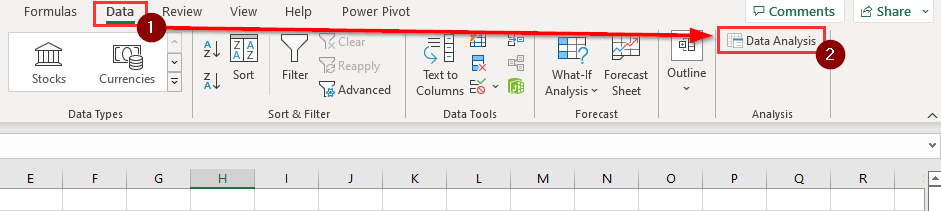
- You should now be able to find the Data Analysis tool in the Data tab. Click on this option to create a covariance matrix in Excel.
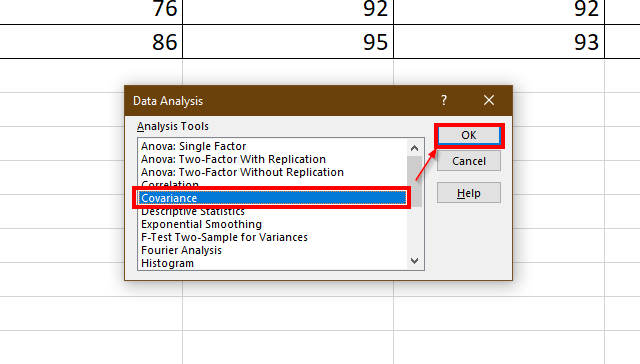
- In the Data Analysis pop-up, select the Covariance option. Click on OK.
- Enter the input range that contains your variable data. You must also select whether your variables are grouped by columns or by rows. In this example, our IQ test partial scores are divided into columns. You must also check the option ‘Labels in first row’ if your range contains the table’s headers.

- Next, we will need to fill out the Output options for our Covariance tool. The user may choose to place the output in the current sheet, a new worksheet, or a new separate workbook. In this example, we will output our results in cell B26.

- The output should be a table that shows the covariance of each possible pair of the chosen set of variables.
These are all the steps needed to create your own covariance matrix in Excel using the Analysis Toolpak add-in.
Frequently Asked Questions (FAQ)
- What does it mean if the covariance is negative, positive, or close to 0?
A negative covariance means that the variables tend to move in opposite directions. If the covariance between two variables is positive, then they tend to covary positively or in the same direction. If the covariance between two variables is 0, there tends to be no significant relationship between the two variables.
This step-by-step guide should provide you with all the information you need to begin using a covariance matrix in your Excel spreadsheet.
You should now have an idea of how to use the covariance matrix to determine which variables in your dataset move together overall.
The covariance matrix is one of many Excel tools you can use in your spreadsheets to analyze statistical data. Our website offers hundreds of other functions and methods to help you get more out of Microsoft Excel.
For example, the Analysis Toolpak add-in can also allow you to create ANOVA tables that will help you determine whether there is a significant difference in the mean of two different groups.
With so many other Excel functions available, you can find one appropriate for your use case.
Don’t miss out on our team’s new spreadsheet tips, tricks, and best practices. Subscribe to our newsletter to stay updated on the latest guides from us!


