This guide will explain how to apply the central limit theorem in Excel.
You can use the central limit theorem to analyze large datasets by assuming properties about the sampling distribution of the mean.
The central limit theorem is an important idea in statistics that you can use to approximate the sampling distribution of a given population.
The theorem states that the distribution of a sample variable will always follow a normal distribution as the sample size increases.
This theorem applies to all populations regardless of the shape of their distributions. If we try to sample a population that follows an exponential distribution multiple times, the mean of our sample variables will always follow the normal distribution.
The central limit theorem also states that the mean of our sampling distribution will approximate the mean of the population.
The theorem also indicates that the standard deviation of the sampling distribution follows the following formula:
standard deviation of sampling distribution = standard deviation of population / square root of sample size
Since we can always rely on the central limit theorem in scenarios with larger sample sizes, we can use this theorem to derive certain statistics.
Let’s take a look at an example where we can apply the central limit theorem in Excel.
Suppose you have a dataset with 1000 observations. The population has a mean of 45 and a standard deviation of 20.
With a sample size of 100, we want to find the mean of random samples obtained from our dataset. What is the mean of this sampling distribution, and what is the standard deviation?
By following the central limit theorem, we can obtain these values without having to actually perform the sampling ourselves.
Since the central limit theorem states that the sampling distribution is always normally-distributed, we can use the NORM.DIST function to determine probabilities.
For example, we can use the NORM.DIST function to calculate the probability that a random sample of size N from a given population is less than or equal to some value x.
Now that we know when we could apply the central limit theorem in Excel, let’s learn how to use it and work on an actual sample spreadsheet.
A Real Example of Using the Central Limit Theorem in Excel
The following section details a sample Excel spreadsheet that applies the central limit theorem. We will use the theorem to find probabilities and describe the sampling distribution of the mean.
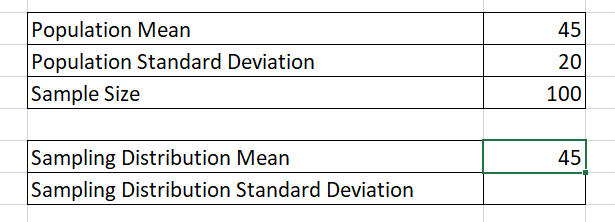
First, let’s take a look at our given values. We have a population with a mean of 45 and a standard deviation of 20. We are using a sample size of 100 to obtain the sampling distribution of the population.

Based on the central limit theorem, we can solve for the sampling distribution’s mean and standard deviation.
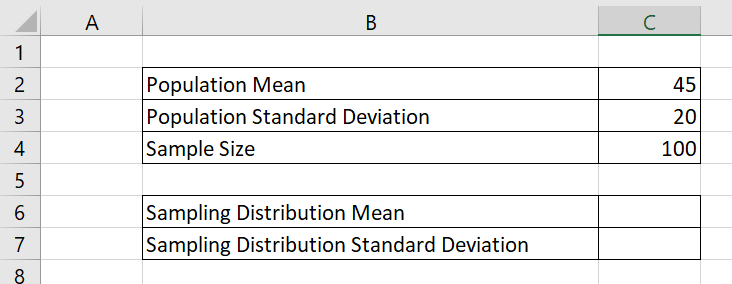
To get the standard deviation, we just need to use the following formula:
= C3/SQRT(C4)
The formula above divides the population’s standard deviation by the square root of the sample size used.
Next, we’ll use the properties guaranteed by the central limit theorem to find certain probabilities.
We want to know the probability that when we get a random sample of 100 values from our dataset, that sample will have a mean less than or equal to 45.
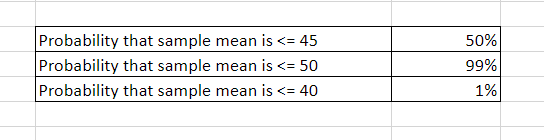
We can use the following formula to find these probabilities:
=NORM.DIST(45,C6,C7,TRUE)
Since we know that the sample mean distribution is a normal distribution, we will use the NORM.DIST formula to find the probability.
You can replace the first argument of NORM.DIST to change the probability you are looking for. For example, the formula reveals that there is a 50% chance that the mean of our random sample will be less than or equal to 45. This result is expected since 45 is the population mean.
Do you want to take a closer look at our examples? You can make your own copy of the spreadsheet above using the link attached below.
If you’re ready to apply the central limit theorem yourself, head over to the next section to read our step-by-step breakdown on how to do it!
How to Apply the Central Limit Theorem in Excel
This section will guide you through each step needed to apply the central limit theorem in Excel. You’ll learn how to use this theorem to infer probabilities and determine the properties of random samples from a larger population.
Follow these steps to use the central limit theorem in Excel:
- First, write down the population’s mean and standard deviation. You should also take note of the sample size you’ll be using for sampling.
- The central limit theorem indicates that the sampling distribution’s mean is equal to the larger population’s mean. We can add a cell reference to the population mean to return the value again.
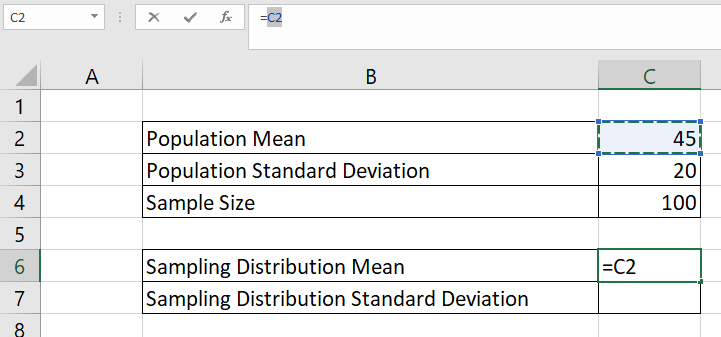
- Hit the Enter key to evaluate this formula.
- Next, we’ll use the formula
=C3/SQRT(C4)to find the sampling distribution’s standard deviation.

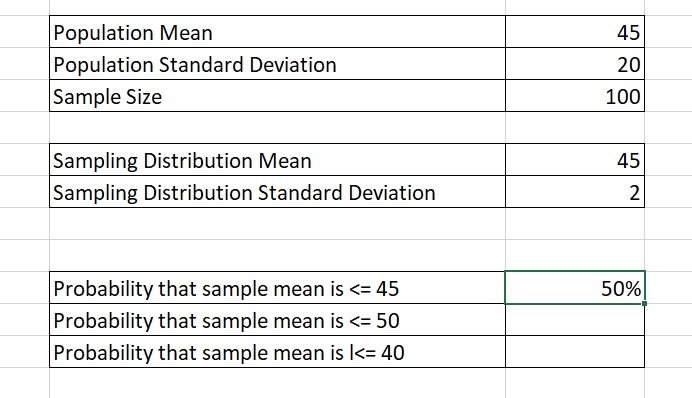
- Type the Enter key to return the standard deviation. In this example, the sample’s standard deviation is 2.

- Next, we will apply the central limit theorem to calculate probabilities about a sample mean result. In this example, we want to know how likely that the mean of our random sample is less than or equal to 40, 45, and 50.

- Use the
NORM.DISTformula to return the probability.

- Hit the Enter key to return the probability. In this example, we now know that the probability that the sample mean is less than or equal to 45 is 50%.
- We can use the same formula to calculate the remaining two probabilities.
These are all the steps needed to apply the central limit theorem in Excel.
This step-by-step guide should provide you with all the information you need to apply the central limit theorem in Excel yourself.
You should now have a clear understanding of what the central limit theorem is. You should now be able to use it on your own spreadsheets for statistical analysis and inference.
The central limit theorem is just one example of the many statistical methods you can use in your spreadsheets. Our website offers hundreds of other functions and methods to help you get more out of Microsoft Excel.
With so many other Excel functions available, you can find one appropriate for your use case.
Don’t miss out on our team’s new spreadsheet tips, tricks, and best practices. Subscribe to our newsletter to stay updated on the latest guides from us!