


This guide will explain how to calculate the mean absolute deviation in Excel.
Excel is a popular tool that people use for different purposes and situations. Since it contains built-in functions and tools, it allows us to easily perform different statistical calculations that would usually be too complex to do manually.
Additionally, we can reduce errors or mistakes in our statistical calculations when we use Excel. For instance, we can use Excel to measure the spread or dispersion in our data set.
Although the range and standard deviation are the most common methods to measure dispersion in statistics, there are other methods as well. In this case, we will focus on calculating the mean absolute deviation to measure the spread or dispersion of our data set.
Usually, it would take a long process which may result in several errors or mistakes to calculate the mean absolute deviation manually. However, we can utilize the several built-in functions in Excel to calculate the mean absolute deviation easily and quickly.
Let’s take a sample scenario wherein we need to calculate the mean absolute deviation in Excel.
Suppose we have a data set containing 10 data values. Since we want to determine how dispersed the values are within our data set, we calculated the mean absolute deviation of our data set using the AVERAGE function and the ABS function in Excel.
Great! Now we can move on and dive into a real example of calculating the mean absolute deviation in Excel.
A Real Example of Calculating Mean Absolute Deviation in Excel
Let’s say we have a data set containing 10 data values. And we want to measure the spread or dispersion of the data values within the data set by getting the mean absolute deviation. So our initial data set would look like this:

Essentially, the mean absolute deviation of a data set is the average distance between each data value and the mean. So we utilize the mean absolute deviation to tell us or give us an idea about the variability or dispersion of our data set.
Furthermore, the mean absolute deviation is also known as the average absolute deviation. To get the mean absolute deviation, the formula used is = (Σ |xi – x|) / n wherein Σ is a symbol that refers to the sum, xi in the formula means the ith data value.
Then, the x refers to the mean value while n refers to the sample size. And we will apply this formula in Excel to calculate the mean absolute deviation in Excel with the help of the built-in functions.
Firstly, we need to find the mean value. To do this, we will use the AVERAGE function to get the mean value for the data values in the data set. So the AVERAGE function returns the average or arithmetic mean of the selected arguments.
For instance, we can input numbers or names, arrays, or cell references that contain numbers as our arguments.
Secondly, we will begin to calculate the absolute deviations. To obtain the absolute deviation in Excel, we will utilize the ABS function. So the ABS function returns the absolute value of the selected number. Basically, the absolute value would be a number without its sign.
Afterward, we can proceed to calculate the mean absolute deviation using the AVERAGE function again. And this will return the mean absolute deviation for the data values within the data set.
To interpret the result of the mean absolute deviation, we can take a look at the value. When the mean absolute deviation is a low value, this indicates or tells us that the data values in our data set are concentrated closely together.
Otherwise, a mean absolute deviation having a high value can indicate or tell us that the data values found in our data set are more spread out or dispersed. Additionally, we can apply this method to calculate the mean absolute deviation of any quantity of data values, may it be 10 values or 1000 values.
Finally, our final data set would look like this:
You can make your own copy of the spreadsheet above using the link attached below.
Amazing! Now we can move on and explain the steps of how to calculate the mean absolute deviation in Excel.
How to Calculate Mean Absolute Deviation in Excel
In this section, we will discuss the step-by-step process of how to calculate the mean absolute deviation in Excel. Furthermore, each step has detailed instructions and pictures to guide you along the process.
To apply this method in your work, simply follow the steps below.
1. Firstly, we need to find the mean value of our data set. To do this, we will utilize the AVERAGE function. So we will type in the formula “=AVERAGE(B2:B11)”. Lastly, we will press the Enter key to return the result.

2. Secondly, we will calculate the absolute deviations of each data value in the data set. In this case, we will be using the ABS function. So we will input the formula “=ABS(B2-$F$2)”. Then, we will press the Enter key to get the result.

3. Thirdly, we will drag down the Fill Handle tool to copy the formula and apply it to the other cells.

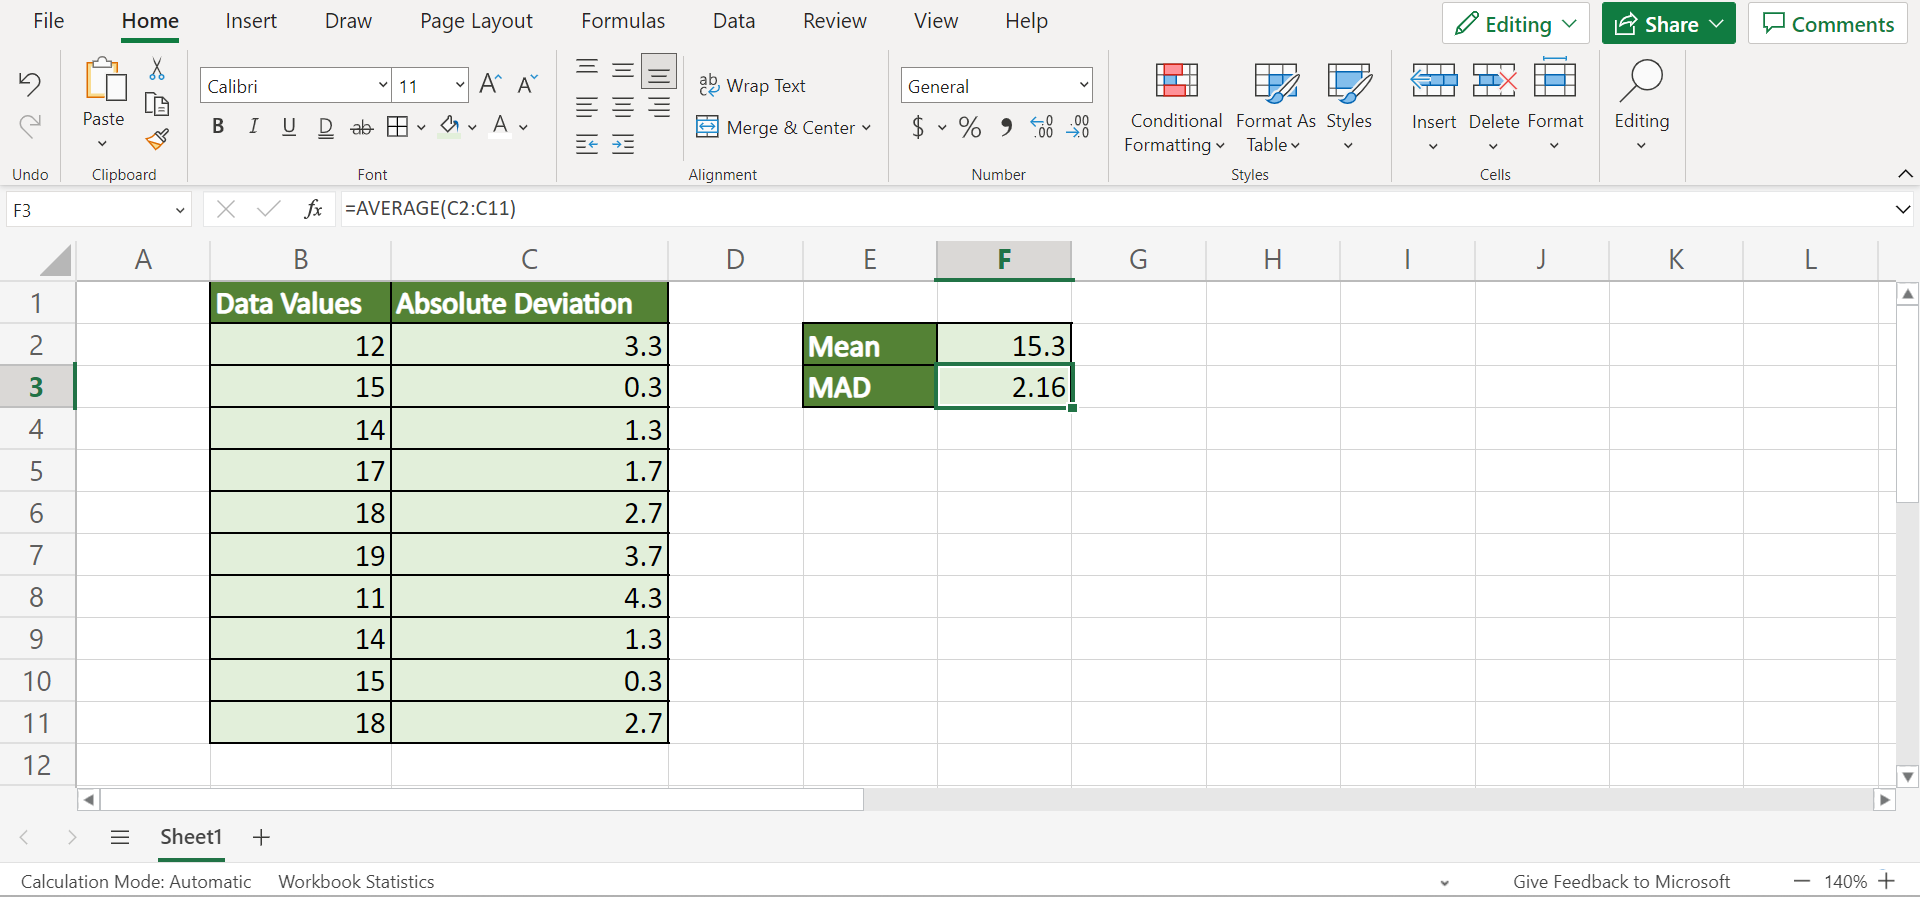
4. Next, we can finally calculate the mean absolute deviation using the AVERAGE function. To do this, we will type in the formula “=AVERAGE(C2:C11)”. Lastly, we will press the Enter key to return the value for the mean absolute deviation.

5. And tada! We have successfully calculated the mean absolute deviation in Excel.
And that’s pretty much it! We have successfully discussed how to calculate the mean absolute deviation using a simple and easy method. Now you can apply the process to your own work whenever you need to determine the variability or dispersion of your data set.
Are you interested in learning more about what Excel can do? You can now use the AVERAGE function and the various other Microsoft Excel formulas available to create great worksheets that work for you. Make sure to subscribe to our newsletter to be the first to know about the latest guides and tutorials from us.


