This guide will explain how to construct a prediction interval in Excel.
The prediction interval uses historical data to estimate where a future observation may fall, given a certain probability.
A prediction interval is a kind of confidence interval often used in regression analysis. The interval defines a range of values that tries to predict the value of a new observation.
Let’s take a look at a quick example where we can use a prediction interval in Excel.
Suppose you have conducted a study that aims to measure the effect of the amount of fertilizer used on a certain plant’s height.
Given a specific amount of fertilizer, we want to identify a range of heights covering 95% of cases. We can calculate a prediction interval in Excel to find this range.
While the formula for the prediction interval is quite complex, we can break the formula down into several smaller calculations.
After setting up each of these calculations, we can use Excel to calculate the prediction interval to predict the value of new observations.
Now that we know when to use the prediction interval in Excel, let’s learn how to set it up in an actual spreadsheet.
A Real Example of Constructing a Prediction Interval in Excel
The following section will detail an example of how to calculate a prediction interval in Excel. We will also explain the formulas and tools used in this specific example.
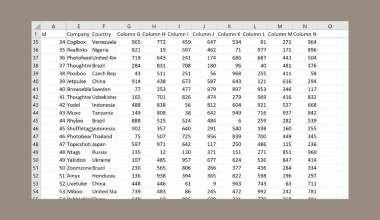
First, let’s take a look at our sample dataset.
We have a dataset of twenty observations. We’ll use the x and y fields to create a model to predict future values of y given new measurements of x.

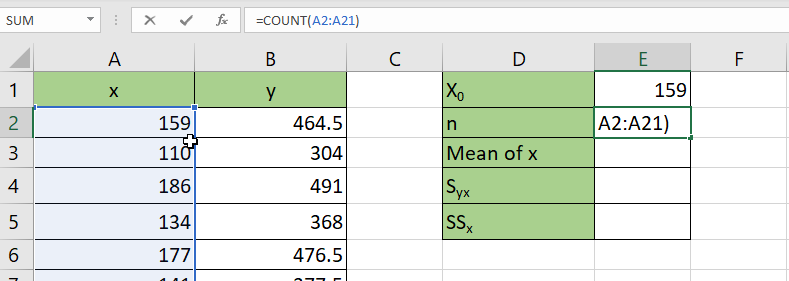
Let’s take a look at the first five calculations we’ll have to make.
The X0 value will equal our new x value. Next, we must find the sample size n and the mean of the x variable. We’ll use the COUNT and AVERAGE functions to retrieve these values.

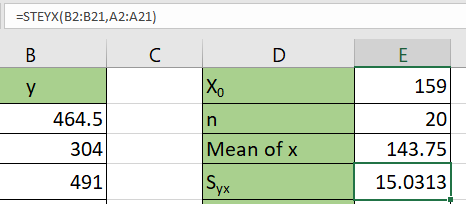
The Syx value refers to the standard error of the predicted y-value for each x in our regression. We’ll also need to find the SSx value. This value is computed as the sum of the squares of the deviations of an array from the array’s sample mean.
To get the value of Syx, we’ll use the following formula:
=STEYX(B2:B21;A2:A21)
To get the value of SSx, we just need to use the following formula:
=DEVSQ(A2:A21)
Next, we’ll need to find the values for Y0, tα/2, and S.E.
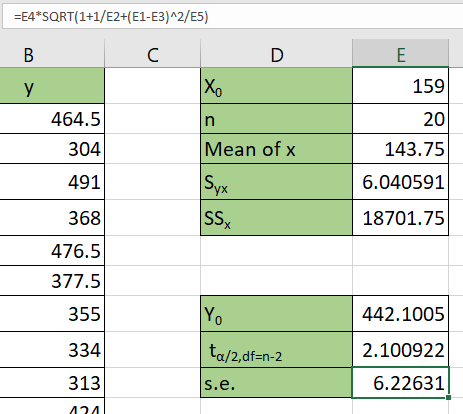
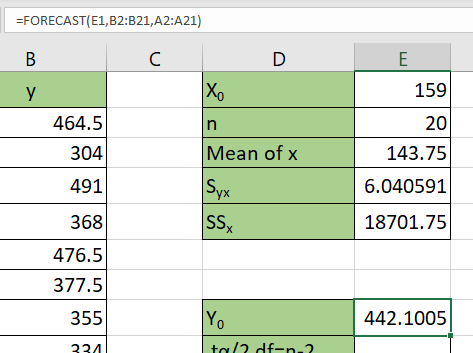
Y0 is a prediction of the y value given a linear model of the known x and y values. We can compute the value of Y0 using the FORECAST formula.
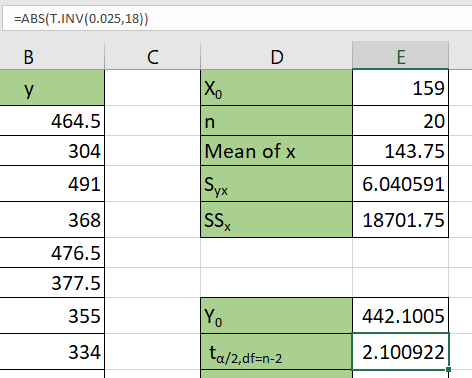
The value for tα/2 refers to the t critical value that corresponds to the value of α/2. If our α is equal to 0.05, then we’ll use the value 0.025 for α/2.
The S.E. value refers to the standard error of the regression.
We can use the following formula to find the standard error:
=E4*SQRT(1+1/E2+(E1-E3)^2/E5)
Once we’ve obtained all these values, we’ll now be able to compute for the lower and upper limits of our tolerance interval.

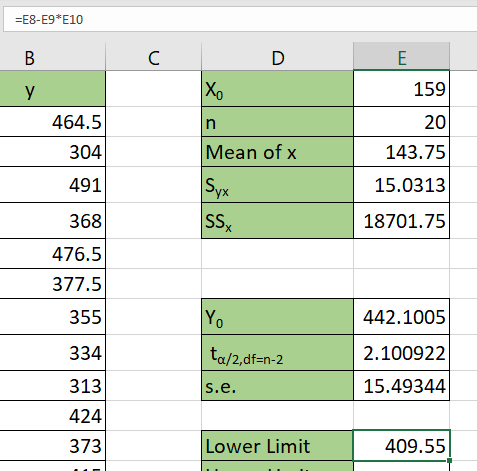
We can use the following formulas to find the lower limit and upper limit of the prediction interval:
=E8-E9*E10
=E8+E9*E10
The formulas above multiply the t critical value by the standard error and either add to or subtract from the Y0 value.
Do you want to take a closer look at our examples? You can make your own copy of the spreadsheet above using the link attached below.
If you want to construct your own prediction interval in Excel, head over to the next section to read our step-by-step breakdown on how to do it!
How to Construct a Prediction Interval in Excel
This section will guide you through each step needed to construct a prediction interval in Excel.
- First, type the value of X0 on your spreadsheet. This number will be the input of our regression model.

- Next, we’ll use the
COUNTfunction to find the sample size n.
- We’ll use the
AVERAGEfunction to calculate the mean of all our known x values.

- We’ll use the
STEYXfunction to return the standard error of our given x and y values.
- We can find the value of SSx through the formula
=DEVSQ(A2:A21).
- We’ll use the formula
=FORECAST(E1;B2:B21;A2:A21)to find the value of Y0.
- We can find the t critical value using the formula
=ABS(T.INV(0.025;18)).
- We’ll use the formula
=E4*SQRT(1+1/E2+(E1-E3)^2/E5)to find the value of S.E.
- Next, we’ll use the formula
=E8-E9*E10to find the lower limit of our prediction interval.
- We’ll use the formula
=E8+E9*E10to find the upper limit of our prediction interval.
These are all the steps you need to calculate the prediction interval in Excel.
This step-by-step guide should provide you with all the information you need to construct a prediction interval in Excel.
We’ve shown how to set up a table to calculate an upper and lower limit of a prediction interval given known x and y values. The interval will tell you a limited range where a predicted value may fall given a certain confidence level.
The prediction interval is just one example of the many statistical methods you can use in your spreadsheets. Our website offers hundreds of other functions and methods to help you get more out of Microsoft Excel.
With so many other Excel functions available, you can find one appropriate for your use case.
Don’t miss out on our team’s new spreadsheet tips, tricks, and best practices. Subscribe to our newsletter to stay updated on the latest guides from us!