This guide will explain how to use continuous probability distribution in Excel.
Excel is an extremely useful tool for several purposes. And it is beneficial for complicated and statistical calculations. For example, we can efficiently perform continuous probability distribution in Excel.
So a probability distribution will depict the expected outcomes of possible values depending on a given data. And there are many kinds of probability distributions. Furthermore, Excel has several statistical functions that make calculating continuous probability distribution simple.
Additionally, the two most common types of continuous probability distributions are uniform probability distribution and normal probability distribution.
Let’s take an example wherein we need to use continuous probability distribution in Excel.
Suppose you are a teacher calculating the scores of your students. And you want to obtain the different probabilities of a student’s score being greater or lesser than the passing grade of 80.
In this case, you want to calculate the normal probability distribution of the score. So you can use the NORM.DIST function, which will make the process more efficient and simple.
Great! Before we move on, let’s first learn the syntax of the NORM.DIST function.
The Anatomy of the NORM.DIST Function
The syntax or the way we write the NORM.DIST function is as follows:
=NORM.DIST(x, mean, standard_dev, cumulative)
Let’s take apart this formula and understand what each term means:
- = the equal sign is how to activate any function in Excel.
- NORM.DIST() is our
NORM.DISTfunction. And this function will return the normal distribution for the selected mean and standard deviation. - x is a required argument. And it refers to the value which we want the distribution.
- mean is another required argument. So it is the arithmetic mean of the distribution.
- standard_dev is also a required argument. And it refers to the standard deviation of the distribution, which is a positive number.
- cumulative refers to a logical value. And it is a required argument. Furthermore, we use TRUE for the cumulative distribution and FALSE for the probability density function.
The Anatomy of the STDEV.P Function
The syntax or the way we write the STDEV.P function is as follows:
=STDEV.P(number1, [number2])
Let’s take apart this formula and understand what each term means:
- = the equal sign is how to begin any function in Excel.
- STDEV.P() is our
STDEV.Pfunction. And this function will calculate the standard deviation based on the entire population selected as arguments. - number1 is the only required argument. And it refers to the corresponding population, which can be numbers or cell references containing the values. Additionally, it can be from 1 to 255 numbers.
- number2 is an optional argument. And it also refers to 1 to 255 corresponding populations, which can be numbers or cell references containing the numbers.
Awesome! Now let’s move on to a real example of using continuous probability distribution in Excel.
A Real Example of Using the TEXTSPLIT Function in Excel
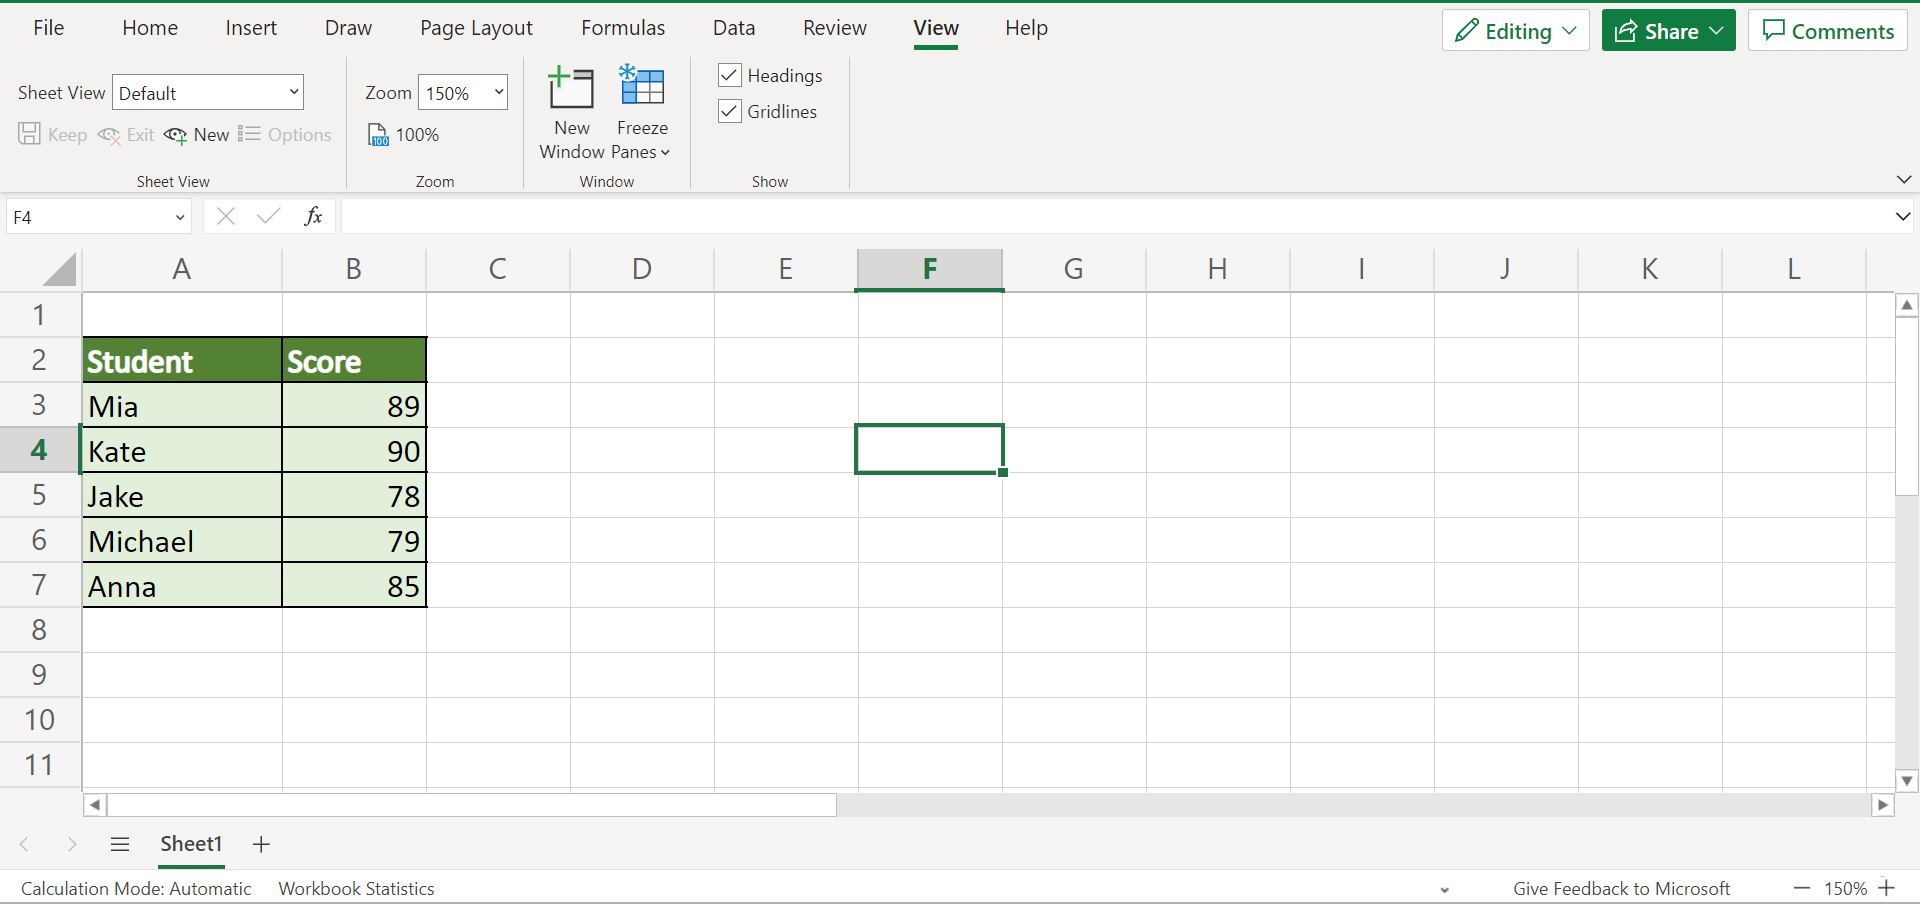
Let’s say we are trying to calculate the normal distribution of the student’s scores. And we want to calculate the probability of their scores being greater or less than the passing grade of 80. So our initial data set containing the students’ raw scores would look like this:
In this case, we are calculating the normal distribution, which is the most common and important continuous probability distribution. And this is represented by a bell-shaped density function.
Firstly, we need to calculate our distribution’s mean and standard deviation. So we can simply use the AVERAGE function to calculate the mean of the distribution. Secondly, we can use the STDEV.P to calculate the standard deviation of the distribution.
Once we have obtained the mean and standard deviation of the distribution, we can now calculate the normal distribution using the NORM.DIST function. Afterward, we can check the probability of a student’s score being greater than the passing grade of 80 by subtracting the formula by 1.
Furthermore, we can also calculate the uniform probability distribution, another type of continuous probability distribution in Excel. Based on the name, it refers to something unchanging with time.
For example, we want to calculate the probability of the train arriving in less than 5 minutes. In this case, we have a data set containing the train’s arrival time, which is represented by the minimum and maximum values.
Then, we will get the difference between the two values, which will be the width of the uniform probability distribution graph. And another factor we need to calculate is the probability density function using the formula f(x)=1/(b-a).
After, we can now calculate the probability of the train arriving in less than 5 minutes using the formula area=height*width=1/(b-a)*(x2-x1).
Finally, our final output would look like this:

You can make your own copy of the spreadsheet above using the link attached below.
Next, let’s learn the process of how to use continuous probability distribution in Excel.
How to Use Continuous Probability Distribution in Excel
In this section, we will discuss the step-by-step process of how to use continuous probability distribution in Excel.
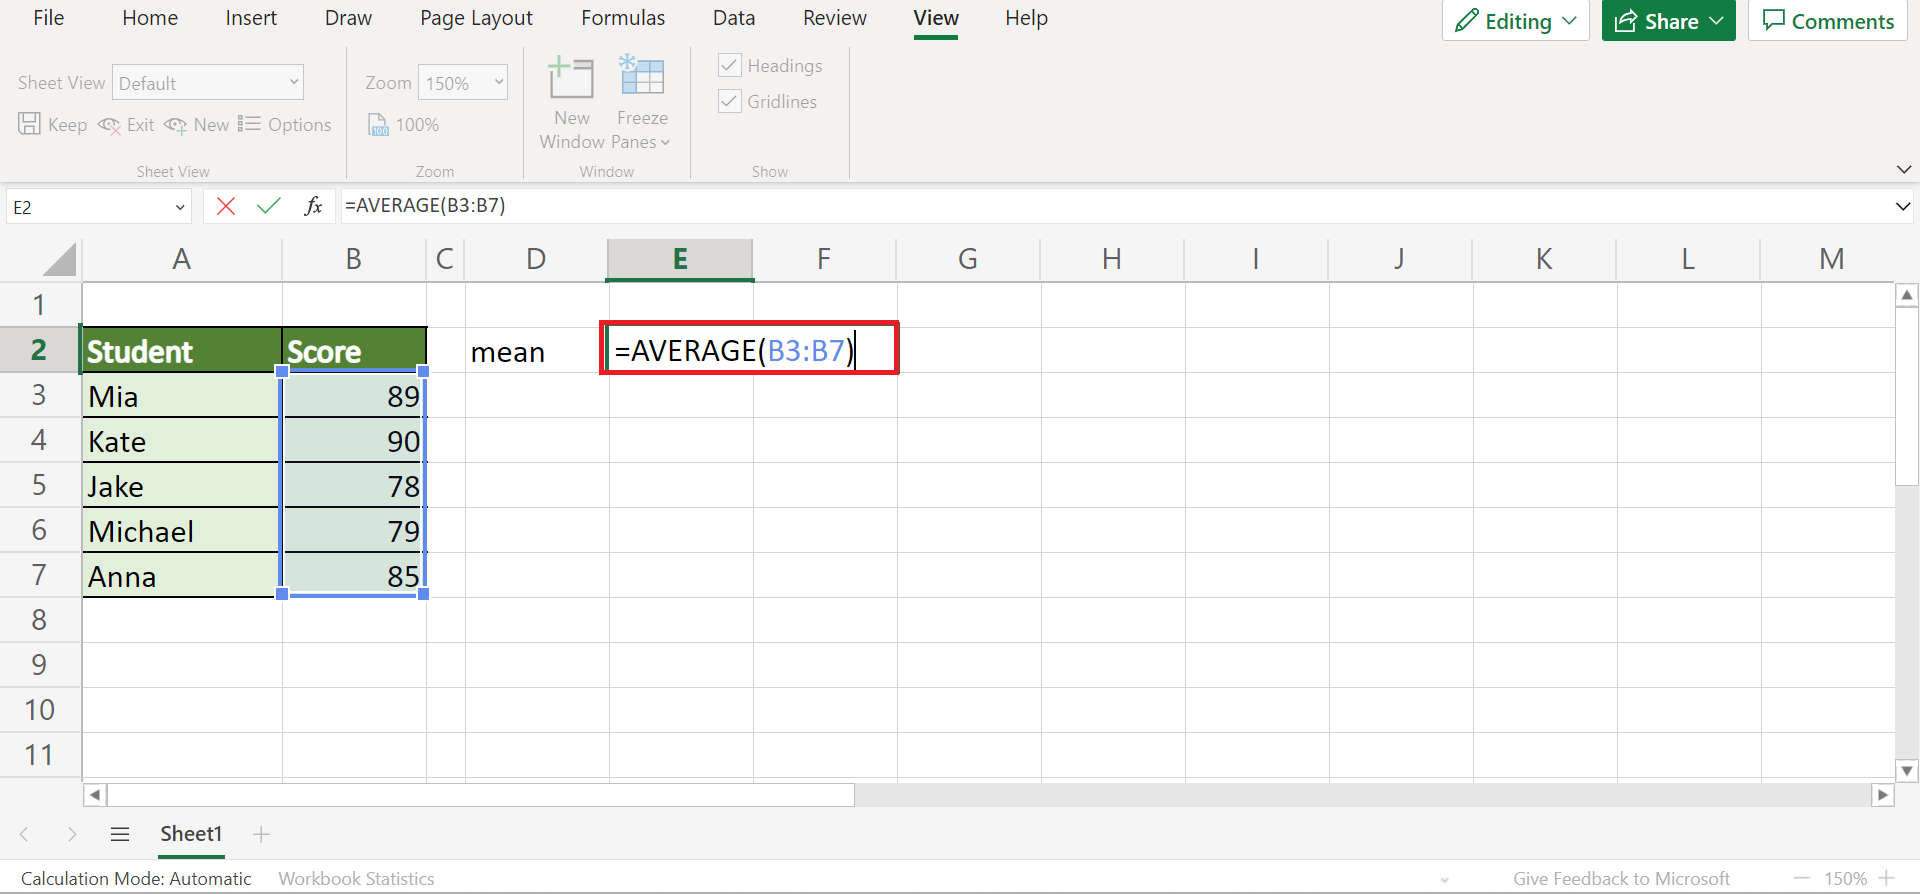
1. Firstly, we will calculate the normal distribution of a population containing the scores of students. But, we need to calculate the mean of the distribution first by using the AVERAGE function. So type in the formula “=AVERAGE(B3:B7)”. Lastly, press the Enter key to return the result.
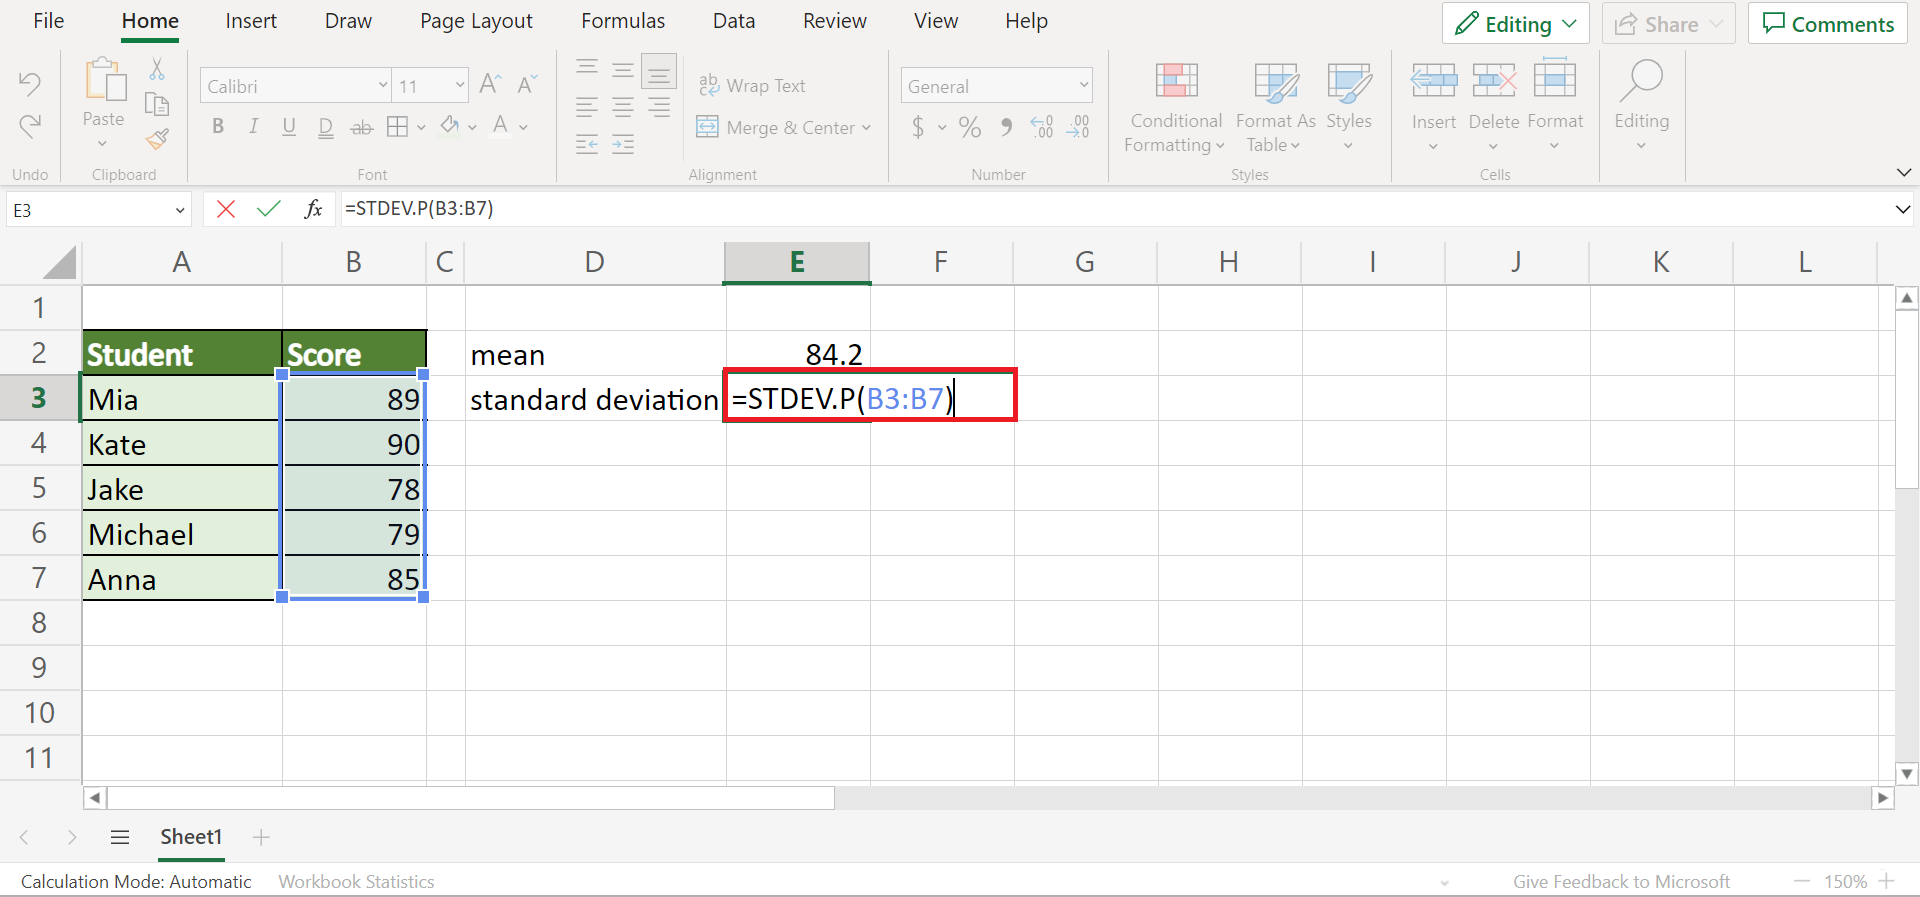
2. Secondly, we need to calculate the standard deviation of the distribution using the STDEV.P function. So input the formula “=STDEV.P(B3:B7)”. Then, press the Enter key to get the result.
3. Thirdly, we will compute the normal distribution of each score. So type in the formula “=NORM.DIST(B3,$F$2,$F$3,FALSE)”. Then, press the Enter key.

4. Next, drag down the formula to apply the formula to the rest of the cells.

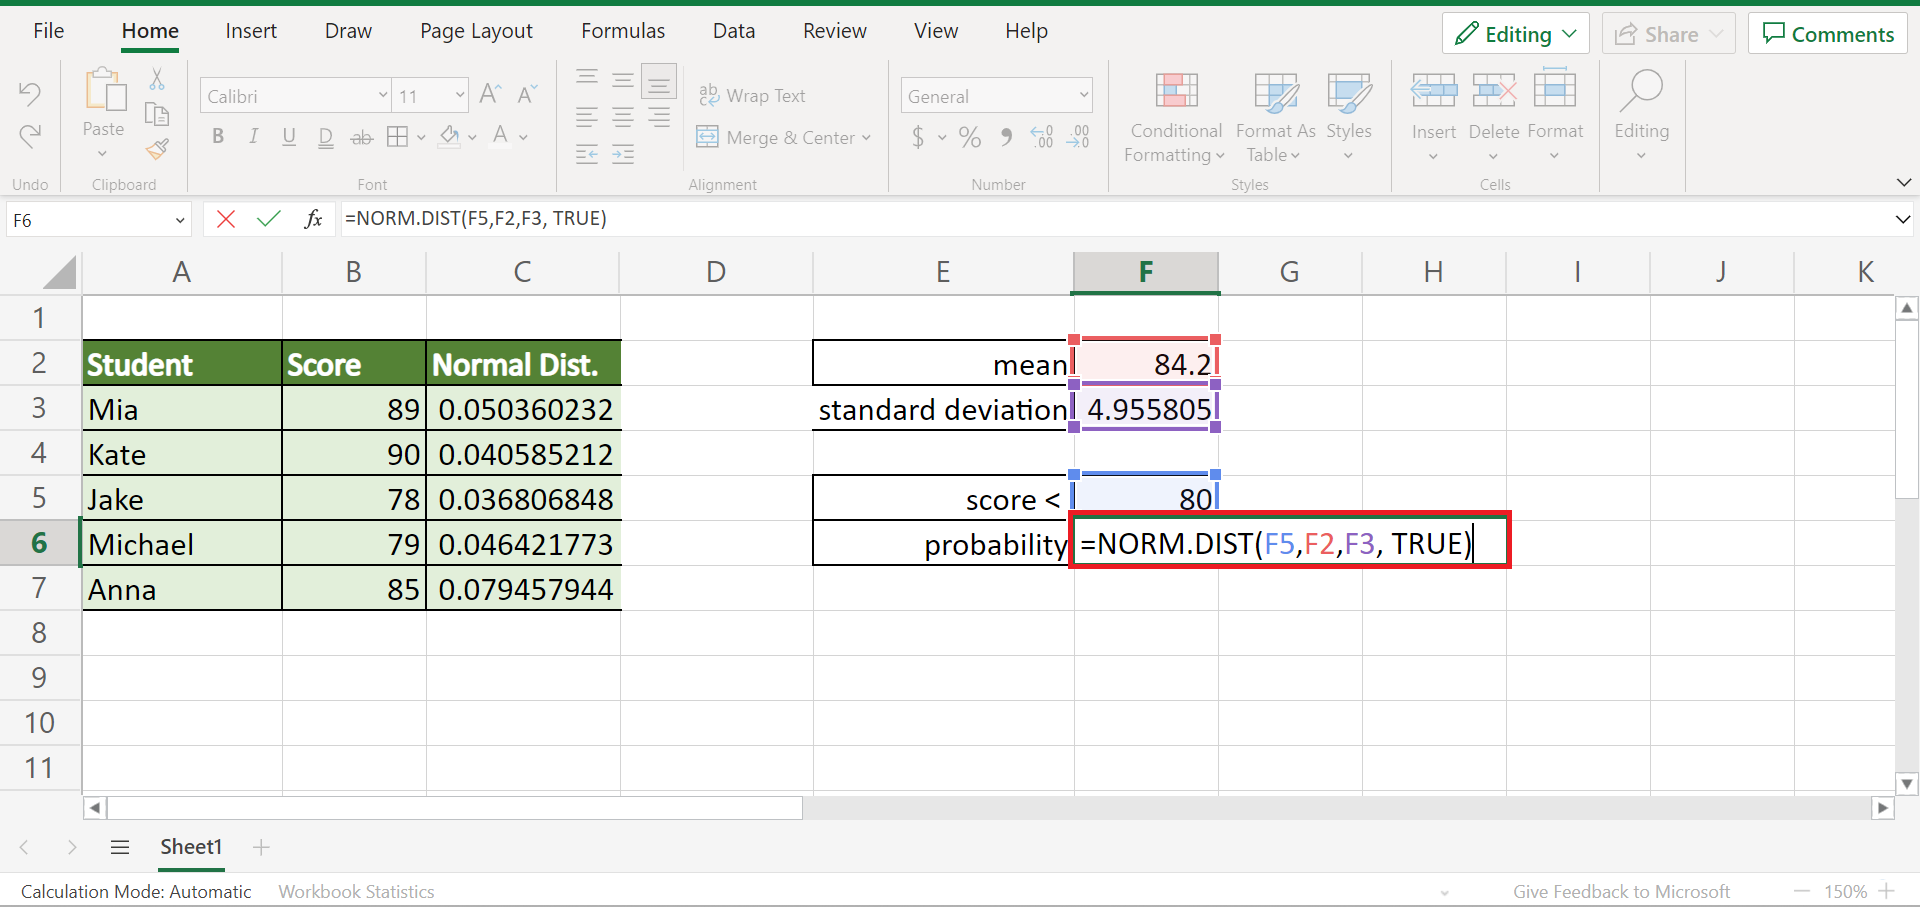
5. After, type in the formula “=NORM.DIST(F5,F2,F3, TRUE)” to get the probability of a score being greater than 80.
6. And tada! We have calculated the normal distribution in Excel.
7. Now let’s calculate the uniform distribution. Firstly, type in the formula “=B12-B11” to subtract the values and get the width.

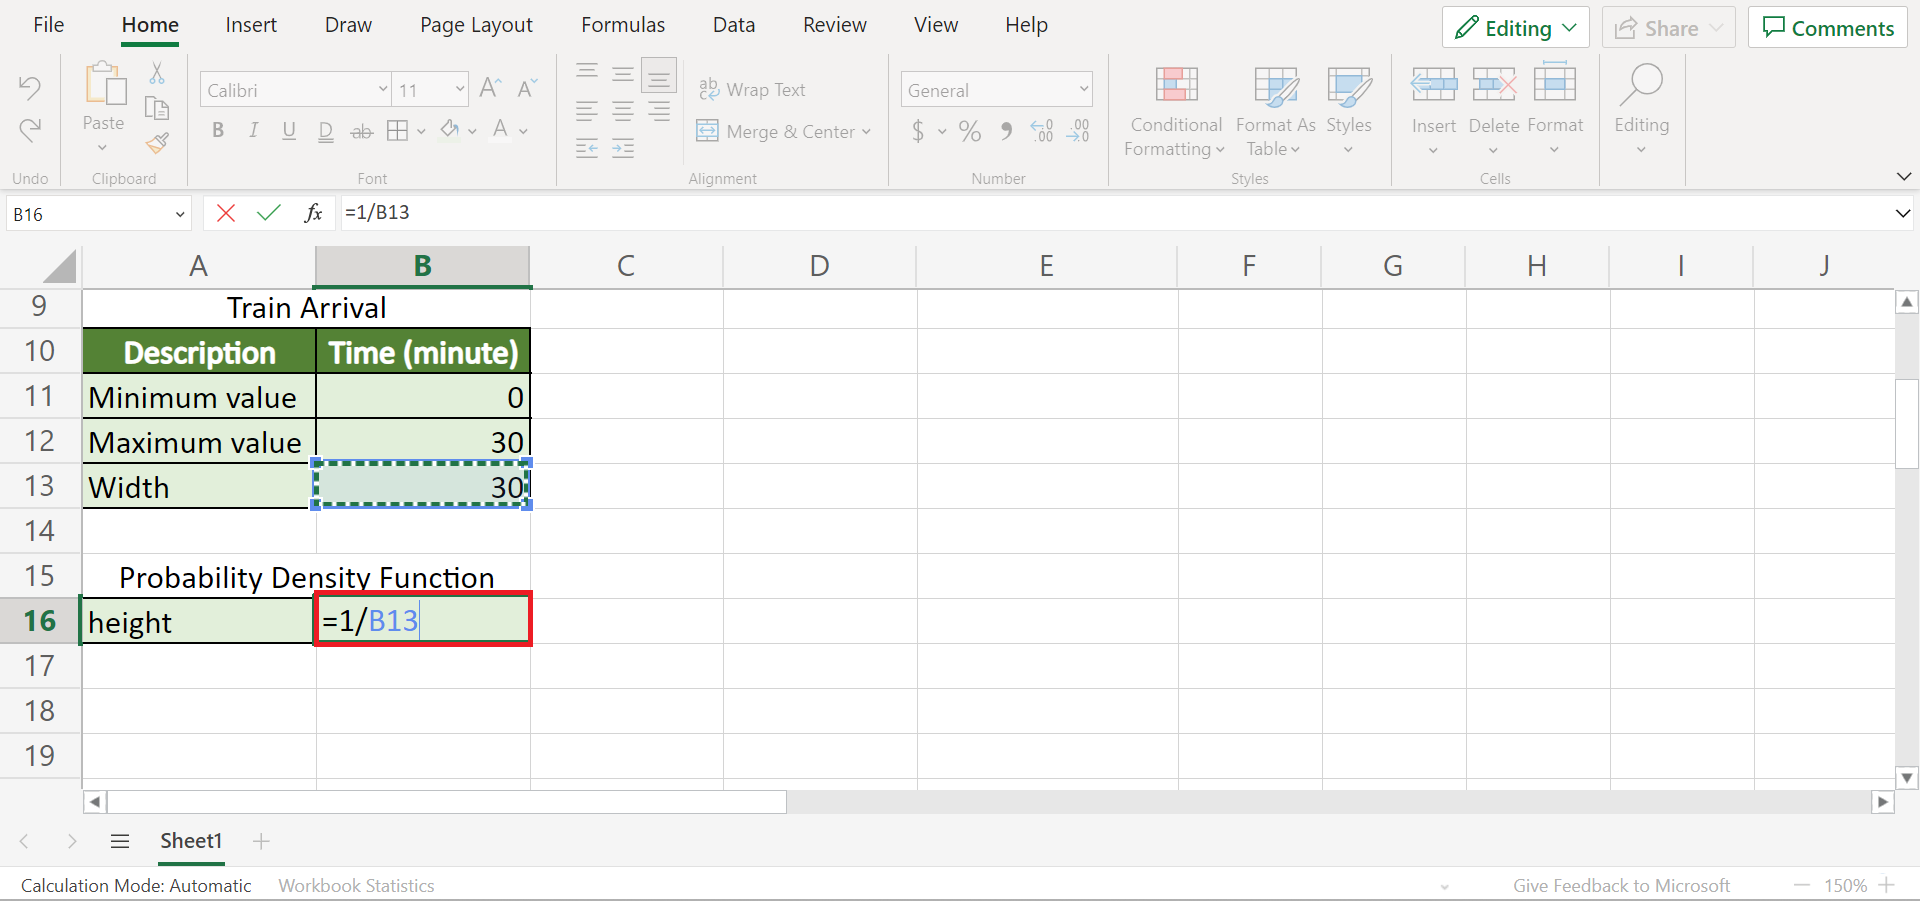
8. Then, input the formula “=1/B13” to get the probability density function.
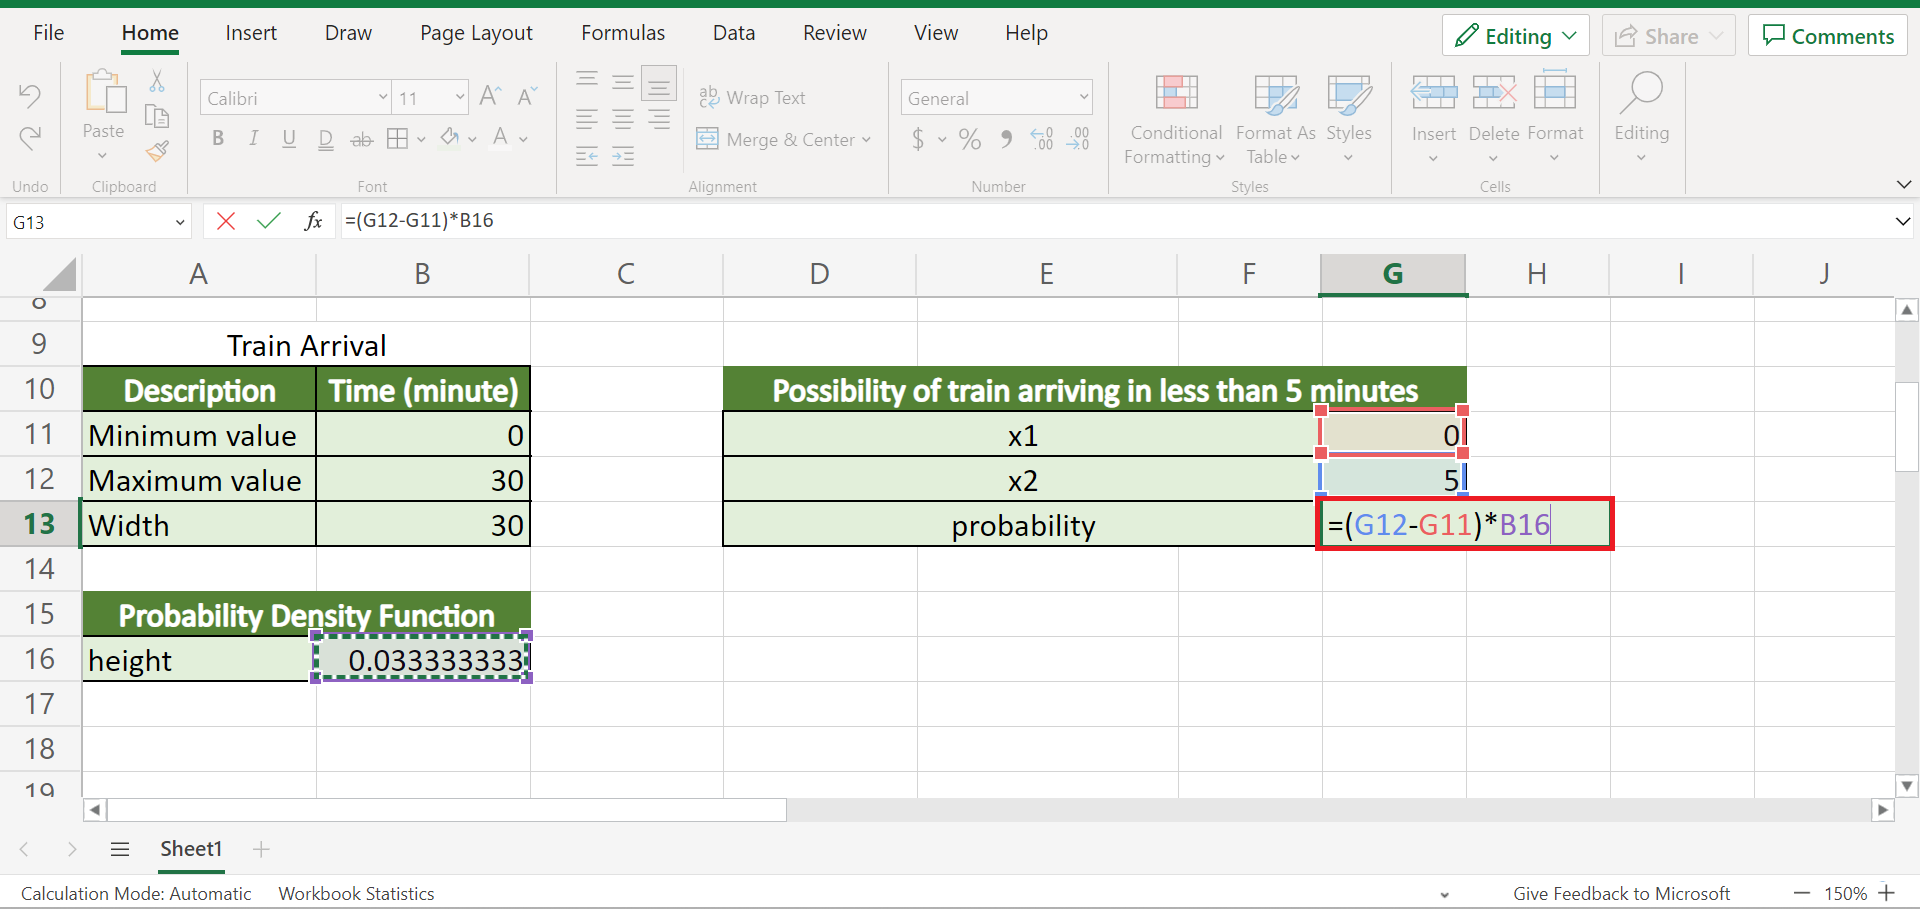
9. Next, we can calculate the probability of the train coming in less than 5 minutes with the formula “=(G12-G11)*B16”.
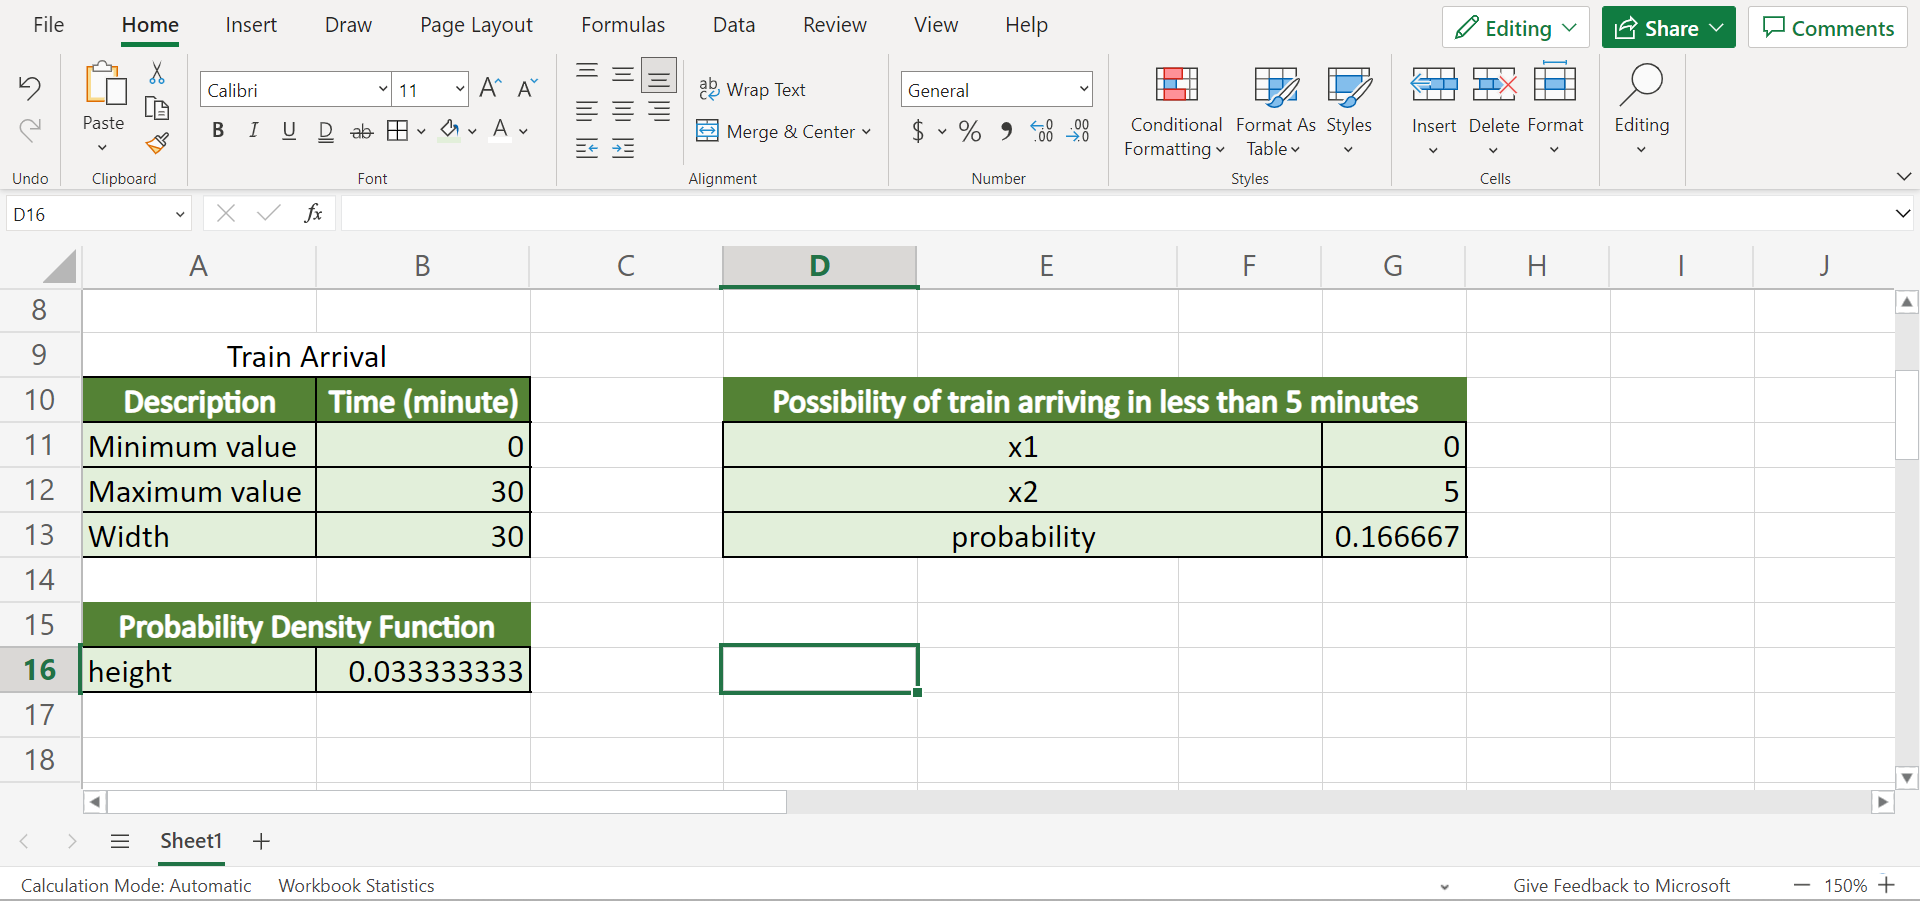
10. And tada! We have successfully calculated the uniform probability distribution in Excel.
And that’s pretty much it! We have discussed two ways to use continuous probability distribution in Excel. Now you can use and apply any of the two methods in your work.
Are you interested in learning more about what Excel can do? You can now use the NORM.DIST function and the various other Microsoft Excel formulas available to create great worksheets that work for you. Make sure to subscribe to our newsletter to be the first to know about the latest guides and tutorials from us.