


This guide will explain how to create a weighted sales pipeline in Microsoft Excel.
Table of Contents
A weighted sales pipeline is a way for businesses to assess the potential revenue and probability of success for each opportunity in a sales pipeline. This method is commonly used in sales forecasting to predict the likelihood of a deal closing.
It is called a weighted pipeline because we assign a value or “weight” to each stage in the sales pipeline. Adding these weights gives different stages more importance to the final result.
Suppose you have two different opportunities at different stages of the sales pipeline. We can use a weighted sales pipeline to compute a forecast amount.
In this guide, we will explain how to set up the probabilities of each stage and how to use these to get the forecasted value of each opportunity in your pipeline. We will also provide a step-by-step guide on how to set up your own weighted sales pipeline using Microsoft Excel.
A Real Example of a Weighted Sales Pipeline in Excel
Let’s explore a simple example of a weighted sales pipeline in Microsoft Excel.
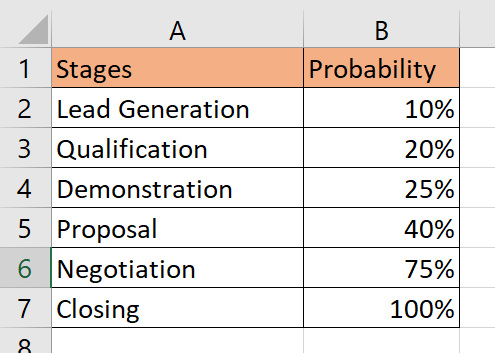
In the table above, we’ve listed all the stages of our sales pipeline and their equivalent probability of closing. Businesses can determine the probability of each stage through discussions with the sales team and by analyzing available historical data.
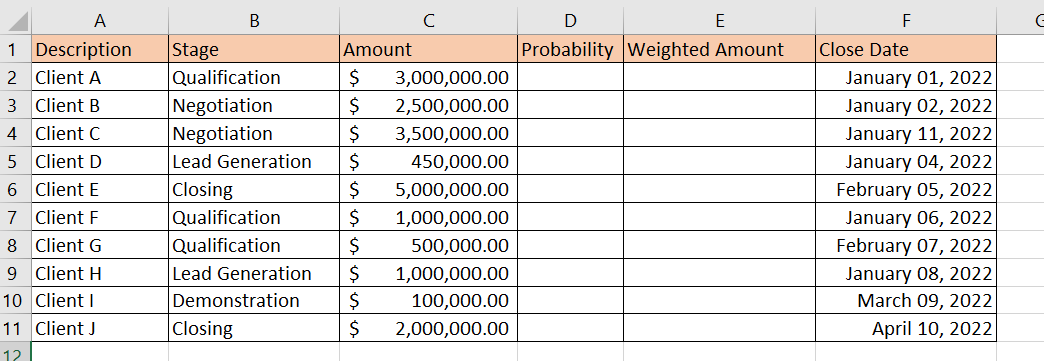
We’ll set up a new Excel table that will allow us to track all active opportunities at different stages of our pipeline. An opportunity refers to any pending business deal that enters the sales pipeline.
For any given opportunity, the user must provide the amount the deal is worth and what stage it is at in the sales pipeline. We can use a VLOOKUP function to return the appropriate probability to use for a given stage. We can then find the weighted amount by multiplying the amount by the probability.
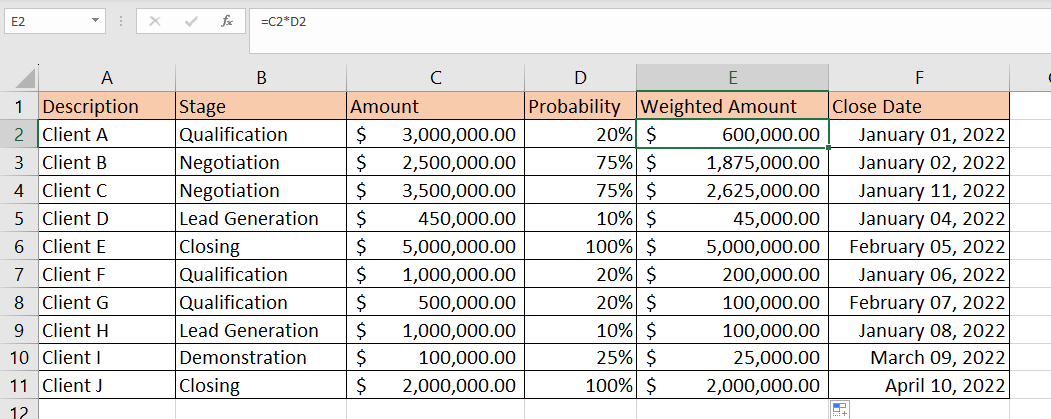
In the table above, we’ve determined the weighted amount of each deal by multiplying the values in the amount and probability fields.
You can make your own copy of the spreadsheet above using the link attached below.
Head to the next section to read our step-by-step tutorial on how to create a weighted sales pipeline.
How to Create a Weighted Sales Pipeline in Excel
- Create a sheet in our spreadsheet labeled ‘Stages’. In this sheet, list all of the steps in your sales pipeline.
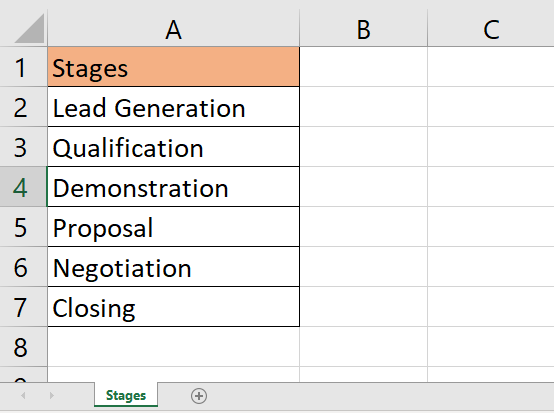 Ideally, you should list these stages in order.
- Next, create a new column in your table and label it ‘Probability’. Using historical data and trends, determine the probability of an opportunity closing at each stage of the pipeline.
The probability of closing a deal should increase the further along the deal is on the sales pipeline.
- Next, create a new sheet labeled ‘Weighted Sales Pipeline’. The columns seen in the image below are just some of the possible fields you can include in your weighted sales pipeline.
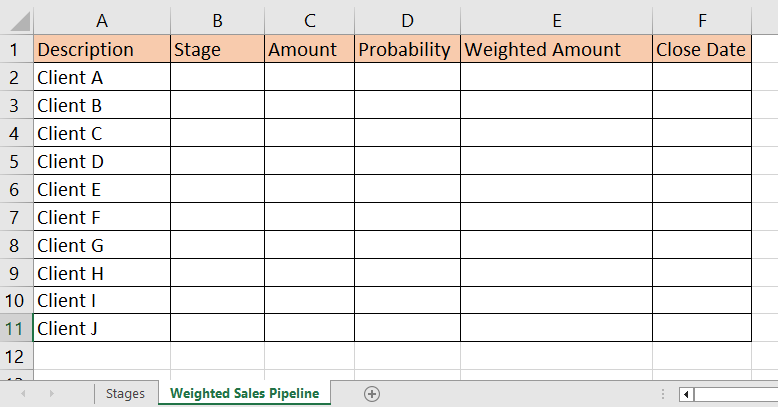 Each row in the table represents a single opportunity or deal that has entered your business’s sales pipeline. At this point, you can fill out the Description field with the name of the client the deal is associated with.
- The Stage column should only hold values from the stages table set up earlier. We can enforce this by adding Data Validation rules to the column.
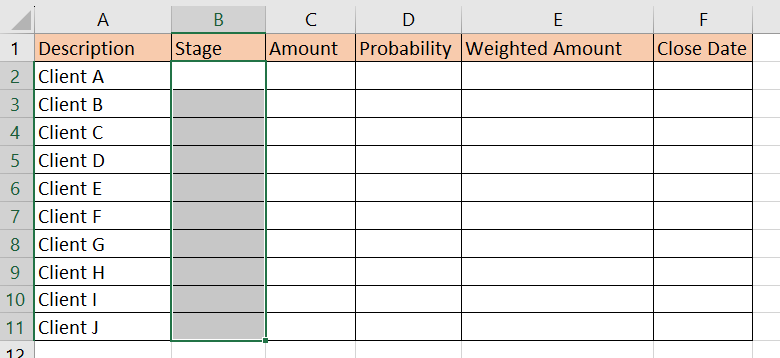 Start by selecting the Stage column.
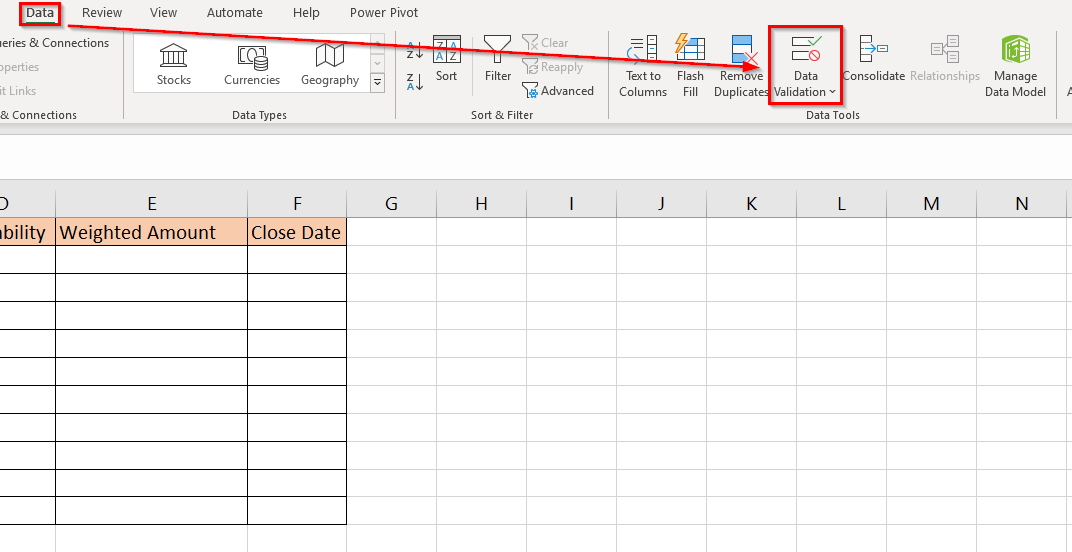
- Next, navigate to the Data tab and select Data Validation.
- In the Data Validation dialog menu, select List as the validation criteria. Add the range with the list of stages as the Source. Check the option labeled ‘In-cell dropdown’.
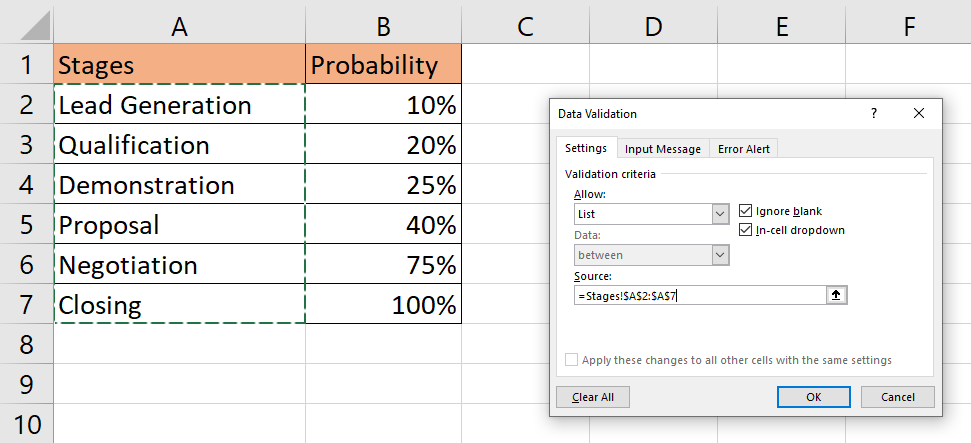 Click on OK to proceed.
- Users should now have a dropdown list to choose the stage of each opportunity.
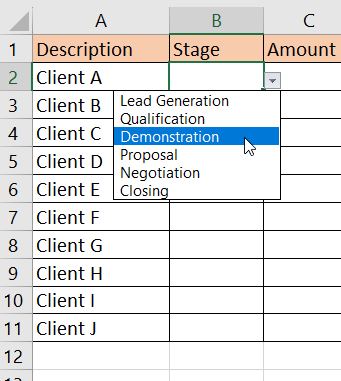 The dropdown menu will make it easier for users to update the stage of each entry as they move further into the sales pipeline.
- Next, ensure that the amount is specified for each opportunity. The amount refers to the deal size or the amount the business is expected to receive after closing the deal.
- Use the
VLOOKUPfunction to find the probability assigned for each stage in the sales pipeline. In the table below, we retrieve the probability using the formula VLOOKUP(B2, Stages!$A$2:$B$7, 2, FALSE).
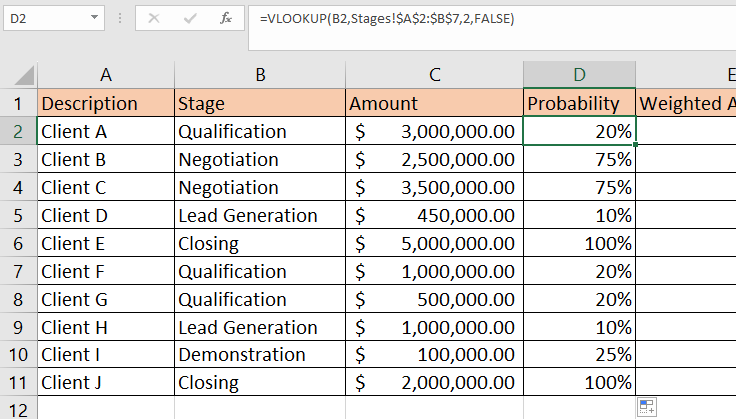
- Multiply the probability by the amount to determine the weighted amount of the opportunity.
- We can find the total expected value by calculating the total of all weighted amounts.

- Updating the stage of a deal will automatically update the total expected value.

These are all the steps you need to follow to set up your own weighted sales pipeline template in an Excel spreadsheet.
FAQs
- Why is a weighted sales pipeline important?
People involved in sales can use the weighted sales pipeline to determine the projected revenue of the business. It also highlights which stages in the pipeline require the most attention or are key indicators for closing a deal.
- When should I use a weighted sales pipeline?
A weighted sales pipeline is best for situations where the business requires a way to forecast future sales accurately. This can be used as an advantage by businesses that are able to find trends in customer data.
You should now be comfortable creating a weighted sales pipeline for your own business. To learn more about using Excel for sales forecasting, you can read our post on how to forecast cash flow in Excel.
That’s all for this guide! Be sure to check out our library of spreadsheet resources, tips, and tricks!


