You might want to find outliers in Google Sheets when you’re analyzing or cleaning any dataset.
Outliers affect the mean and median of your dataset and may result from errors in the data. Finding outliers allows you to address these values and help clean your data.
Outliers refer to values at the extreme ends of a dataset. These extreme values may be due to incorrect data entry or measurement errors. However, there are also many cases where outliers naturally occur in a population. These are known as true outliers.
True outliers can be found everywhere in real life. If you look at the sprint times of a random sample of college students, you may encounter natural-born athletes that show as outliers in the data.
Let’s take a look at a quick example of a use case where we might need to find outliers.
As a statistician, you encounter multiple datasets that are not exactly clean. We want to find outliers that may drastically affect or skew our dataset. For example, let’s say we were to get the average salary of people in an office. A CEO that earns five times more than the next highest-selling employee will drastically skew the results upwards.
We can find outliers using various methods. One of the most common methods is the IQR or interquartile range method. First, we identify the quartiles of our dataset, specifically the first and third. The range between these quartiles is known as the interquartile range. The values found within this range compose the middle 50% of the dataset.
The idea is to create a larger range around the IQR so that any value outside of his extended range is considered an outlier. The minimum and maximum limits are computed using the constant 1.5 and multiplying them by the IQR (Q3 – Q1).
Let’s learn how to find outliers ourselves in Google Sheets and test out the formulas with an actual dataset.
A Real Example of Finding Outliers in Google Sheets
Let’s look at a real example of finding outliers in a Google Sheets spreadsheet.
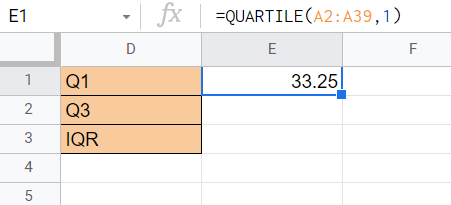
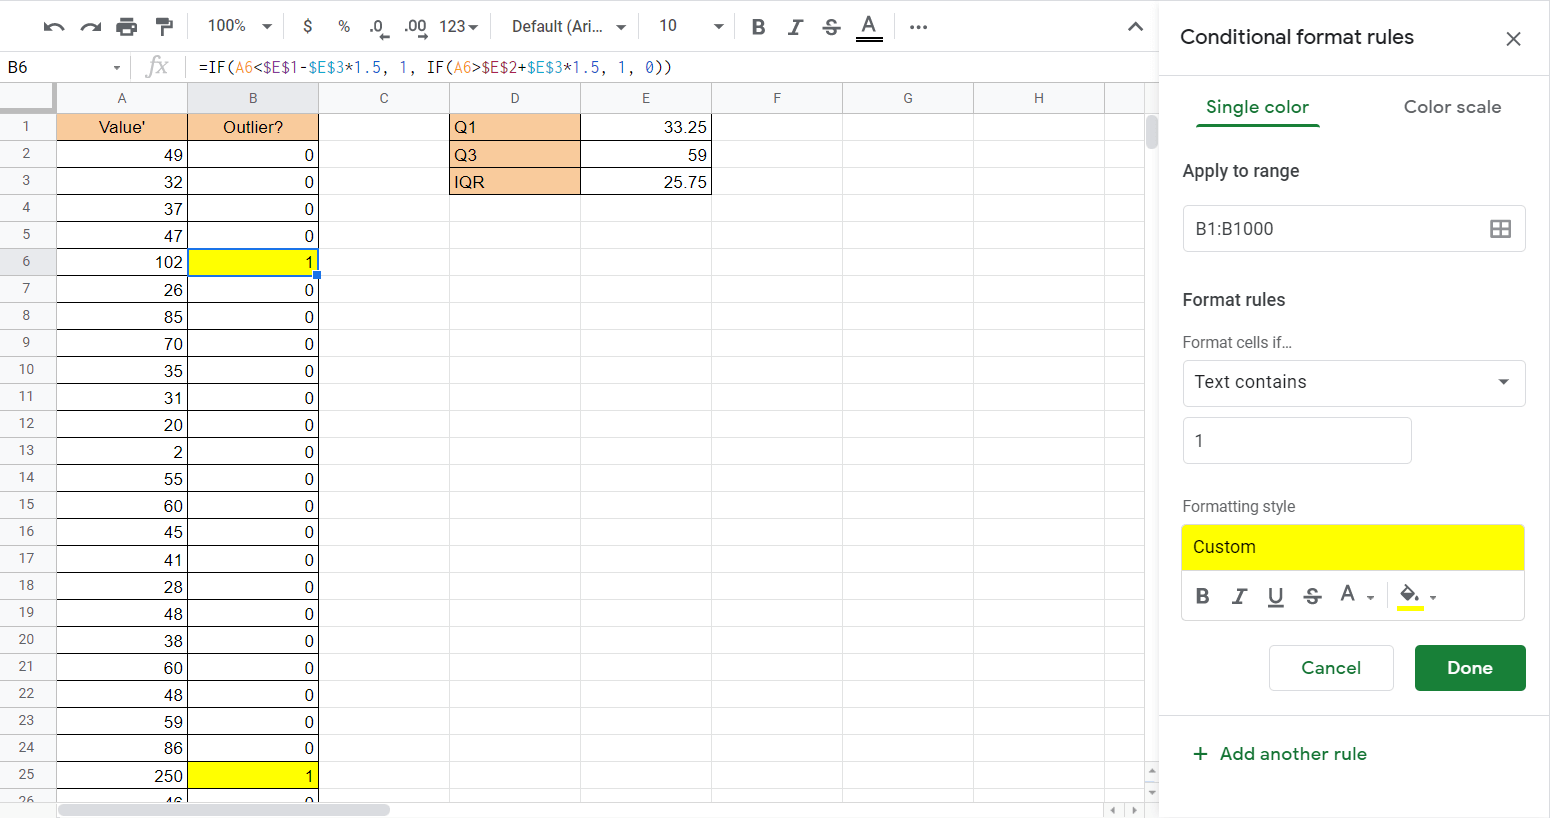
In the example below, we have a list of values that we want to check. In cells E1 and E2, we could output the first and third quartile. This was accomplished using the QUARTILE function.
Afterward, we get the IQR by finding the difference between these quartiles. Once we obtain these three values, we can use a formula to flag outliers in column B. We also add conditional formatting to easily find these outliers easily.

To get the values in Column B, we just need to apply the following formula:
=IF(A2<$E$1-$E$3*1.5, 1, IF(A2>$E$2+$E$3*1.5, 1, 0))
In this formula, we use two IF functions to check whether the value is an outlier or not. First, it checks if the value is less than the lower fence. If it is, then it will return 1. If not, it will check if the value is greater than the upper fence. A greater value will return 1, and 0 if not. Values marked 1 are your outliers.
You can make your own copy of the spreadsheet above using the link attached below.
If you’re ready to try finding outliers in Google Sheets, let’s start setting up a similar spreadsheet ourselves!
How to Find Outliers in Google Sheets
In this section, we will go through each step needed to find outliers in Google Sheets. This guide will show you how we could flag outliers in our previous example.
Follow these steps to start finding outliers:
- First, we’ll have to find the first quartile of the range.
- Next, we’ll compute the third quartile of the dataset.

- After finding Q1 and Q3, we find the difference to get the IQR.

- We can use the formula shown earlier to determine whether a value is an outlier.

- Finally, we can drag the formula down to find the outliers in our dataset.

- We can add conditional formatting on the second column to have a better visual indicator. In the example below, we added conditional formatting so that a value of 1 highlights the cell.
Frequently Asked Questions (FAQ)
- Why do outliers matter?
Outliers can have a major effect on your statistical analyses. Big outliers can make it challenging to conduct hypothesis tests. Once your outliers have been identified, it’s up to the statistician to decide whether or not to retain or remove them. The logic behind making that decision depends on the type of data you have and the purposes of your analysis. - When should I remove outliers?
Some outliers are simply measurement errors or data entry errors. It’s also possible that the outlier is the result of incorrect processing of data.
Sometimes you might want to retain outliers since you might not be sure that they are not true outliers. With a large enough sample, outliers are more likely to occur but have less of an impact on the overall variability of your data.
That’s all you need to remember to start finding outliers in Google Sheets. This step-by-step guide shows how simple it is to flag outliers that may skew your statistical analysis.
Finding outliers is just one of many statistical functions you can perform in Google Sheets. With so many other Google Sheets functions out there, you can surely find a formula or function to help you with your analysis.
Are you interested in learning more about what Google Sheets can do? Stay notified of new Google Sheets guides like this by subscribing to our newsletter!