


This guide will discuss how to group values in the pivot table by range in Excel.
Since it has several built-in functions and tools, Excel has always been a popular tool to use for multiple situations. When we want to store, organize, and manipulate data, we can easily perform these in Excel.
And one of the most powerful tools Excel has is the pivot table. The pivot table essentially categorizes data, allowing us to calculate, analyze, and summarize them. Additionally, we can easily point out patterns or trends in our data set when we put them in a pivot table.
In this case, we will utilize the pivot table to group values by range. So it is similar to creating a frequency table since we are grouping values by ranges. Fortunately, this can easily be done using the group option of the pivot table.
Let’s take a sample scenario wherein we need to group values in a pivot table by range in Excel.
Suppose you have surveyed different age groups. And you want to group the results by different age ranges. To do this, you placed your data set into a pivot table and used the group option to group the age values into ranges.
Great! Now we can move on and dive into a real example of grouping values in a pivot table by range in Excel.
A Real Example of Grouping Values in Pivot Table by Range in Excel
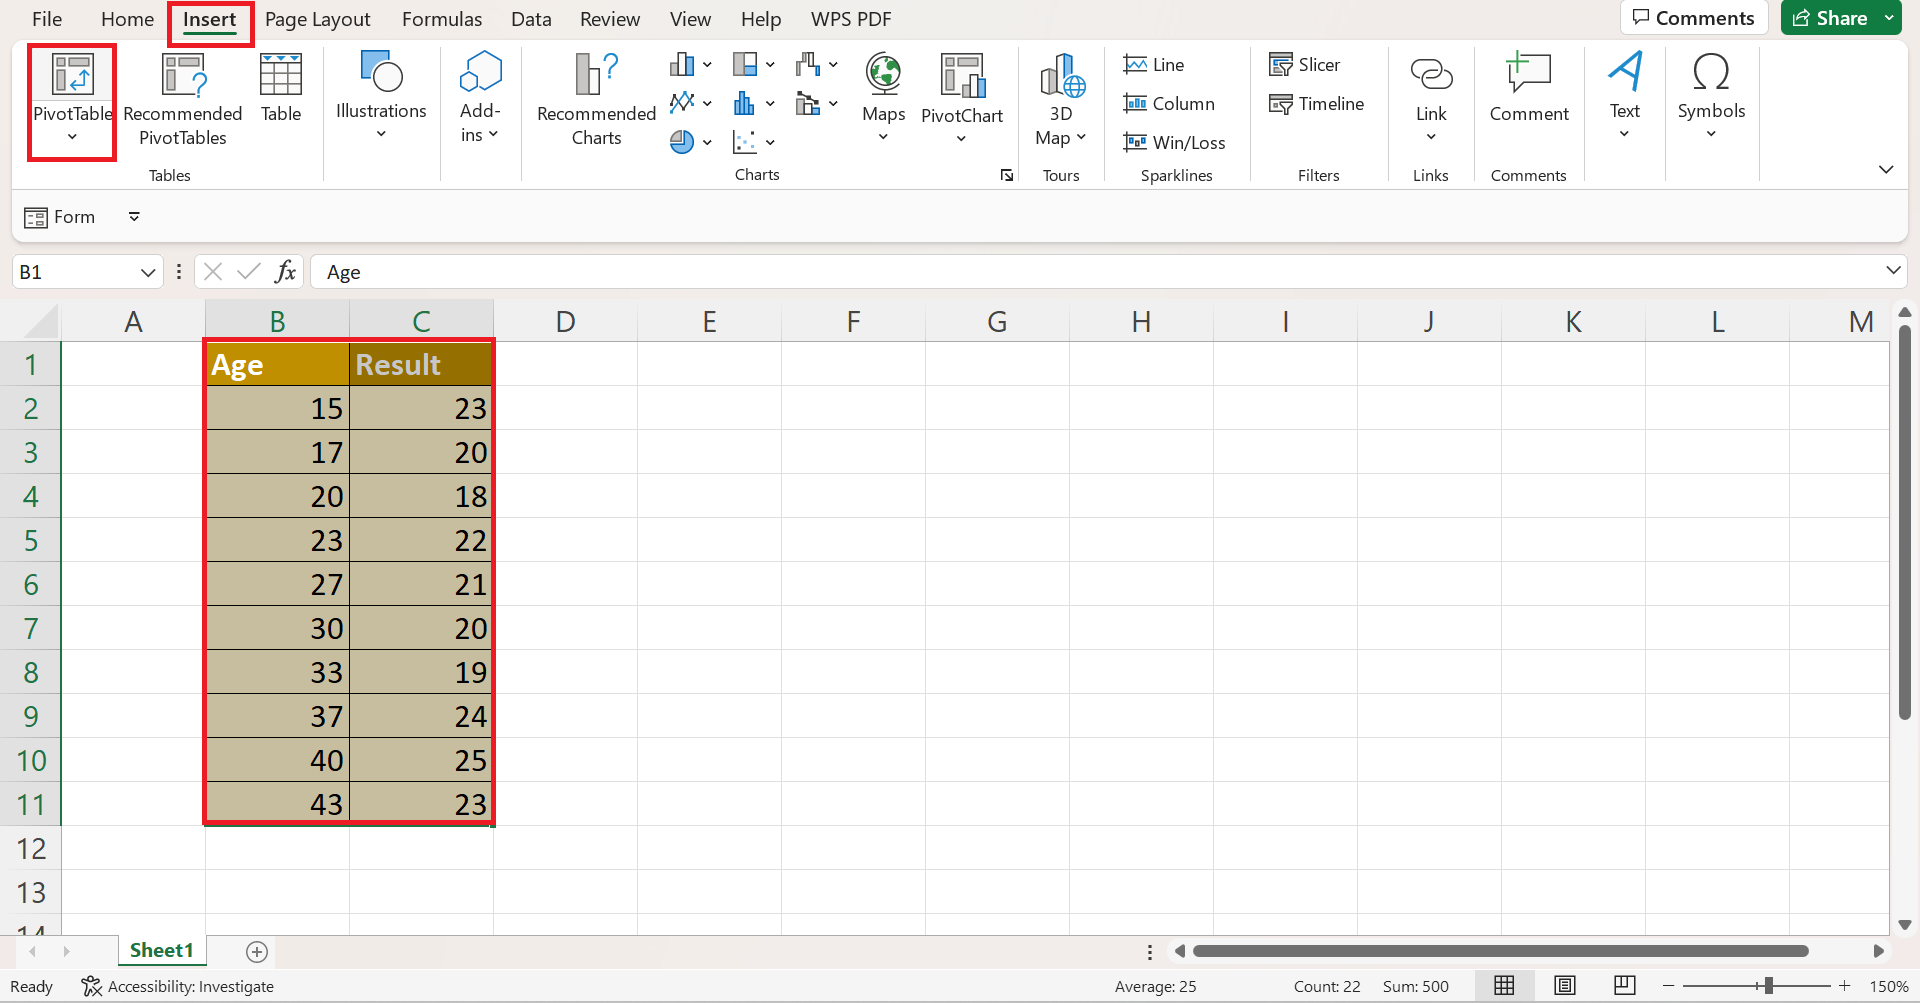
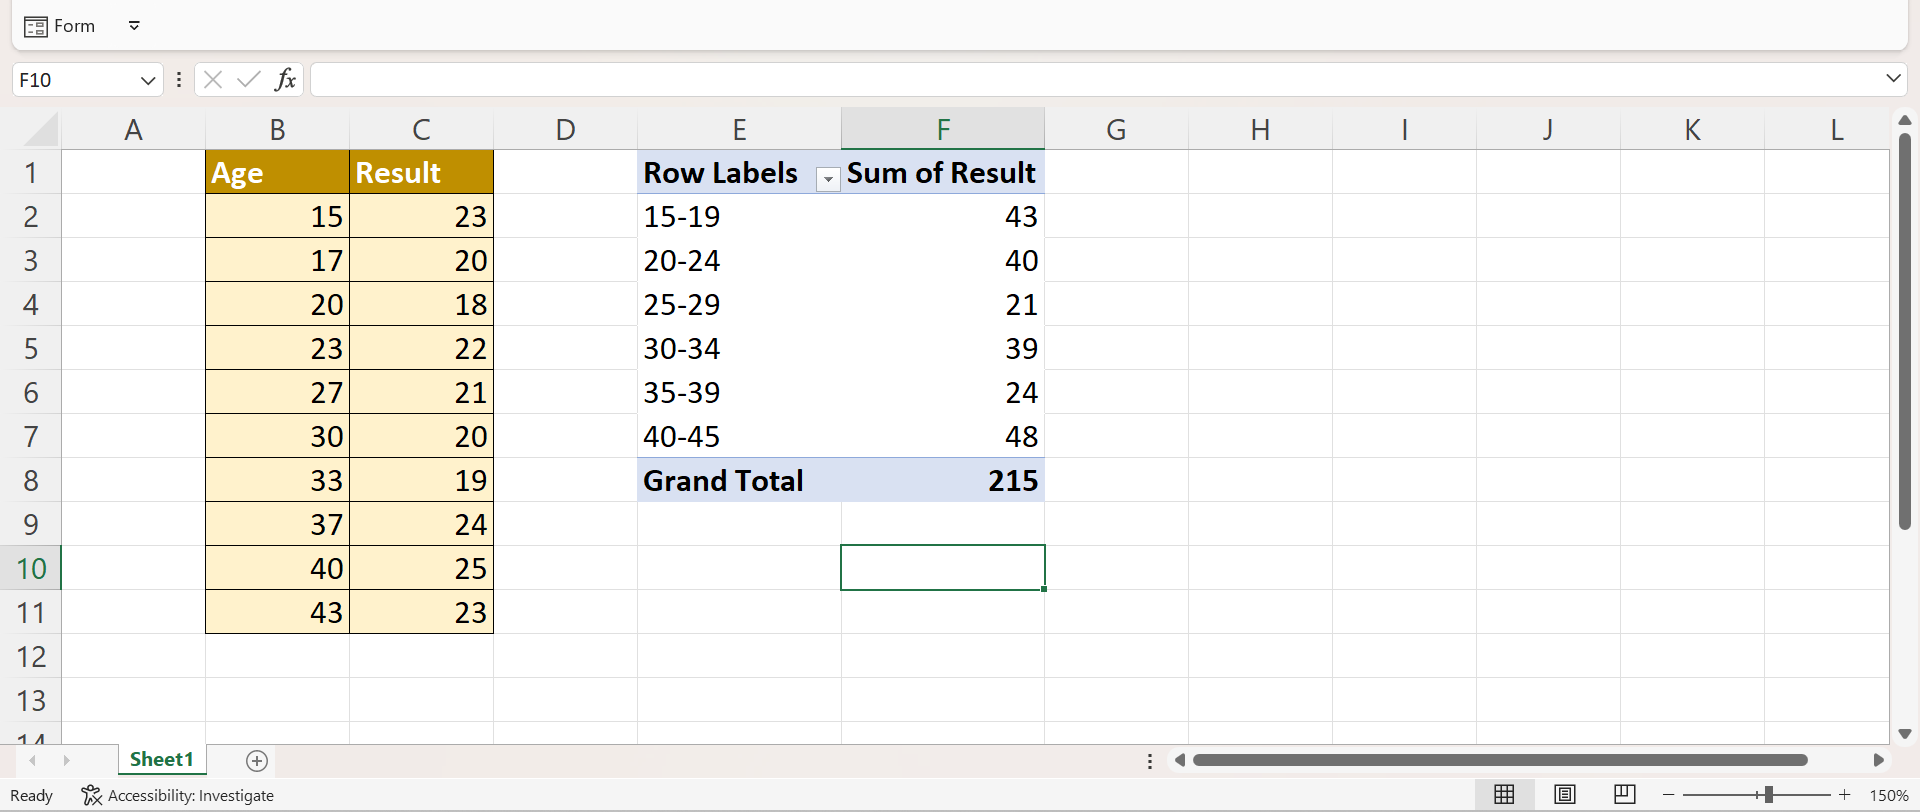
Let’s say we have a data set from our survey. For example, we have two columns containing the respondent’s age and the survey’s result. So our initial data set would look like this:

We want to group the results from the survey by the different age ranges.
Fortunately, we can easily do this using the pivot table. Furthermore, a pivot table is a powerful tool in Excel that we can use to summarize, analyze, and present a summary of data.
So the pivot table allows us to easily compare our data and spot patterns and trends in the data set. Additionally, the pivot table has many features we can utilize to manipulate our data set.
To do this, we need to use the group option of the pivot table. So the grouping option of the pivot table allows us to easily group data values by different criteria or conditions. For instance, we can group data by date and time. In this case, we will group the data values by range.
Furthermore, there are multiple ways to go about using the group option. Firstly, we need to convert our data set into a pivot table.
Then, we can add or display the necessary field in our pivot table. Afterward, we can now use the grouping option of the pivot table. In the grouping menu, we can specify the starting and ending values of our range as well as the intervals.
For instance, we want our starting value to be 15 and an ending value of 45 with an interval of 5. And the pivot table will group the values according to the inputted range values.
Another method to utilize the group option of the pivot table is by using the pivot table analyze tab in the ribbon. From there, we can choose the group selection option, and it will follow the same process from there.
So our final data set would look like this:

You can make your own copy of the spreadsheet above using the link attached below.
Amazing! Now we can learn the process of how to group values in a pivot table by range in Excel.
How to Group Values in Pivot Table by Range in Excel
In this section, we will explain the step-by-step process of how to group values in the pivot table by range in Excel. Additionally, each step contains detailed instructions and pictures to guide you through the process.
To apply this method to your work, simply follow the steps below.
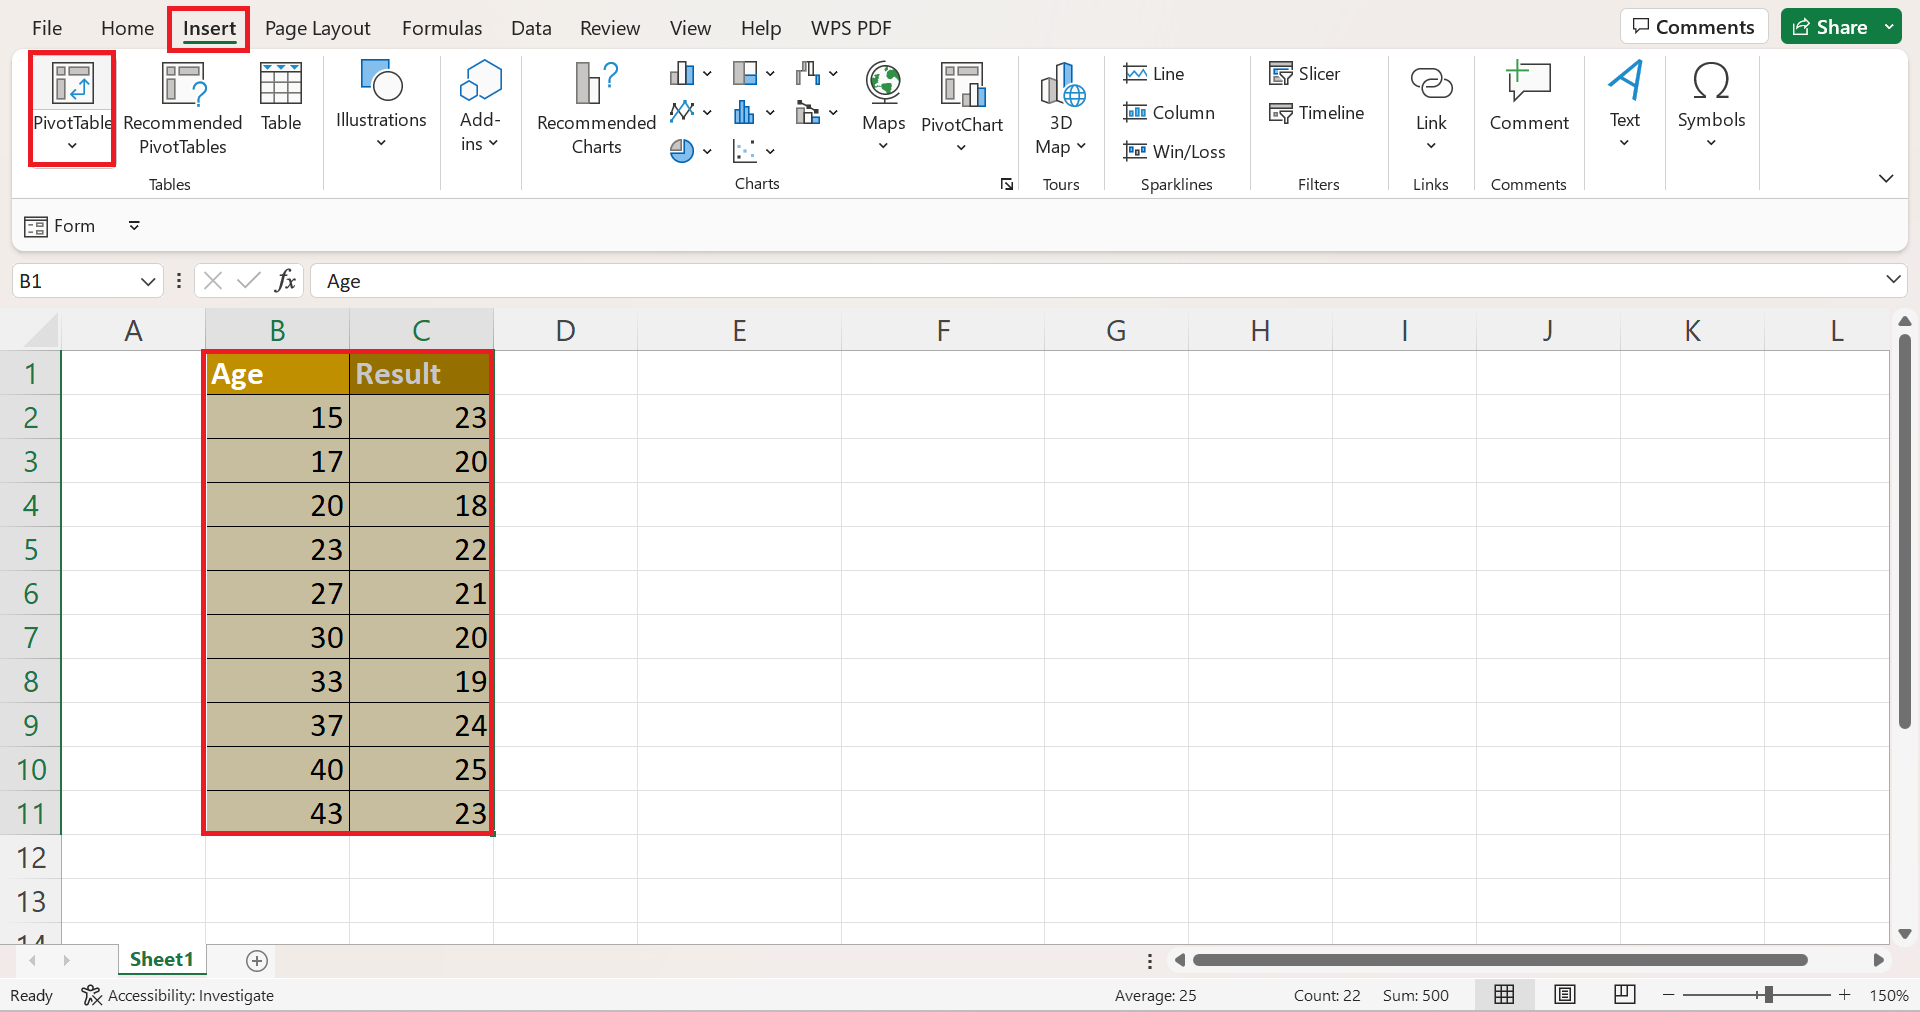
1. Firstly, we need to convert our data set into a pivot table. To do this, we will select the entire data set and go to the Insert tab. From there, we will click PivotTable.
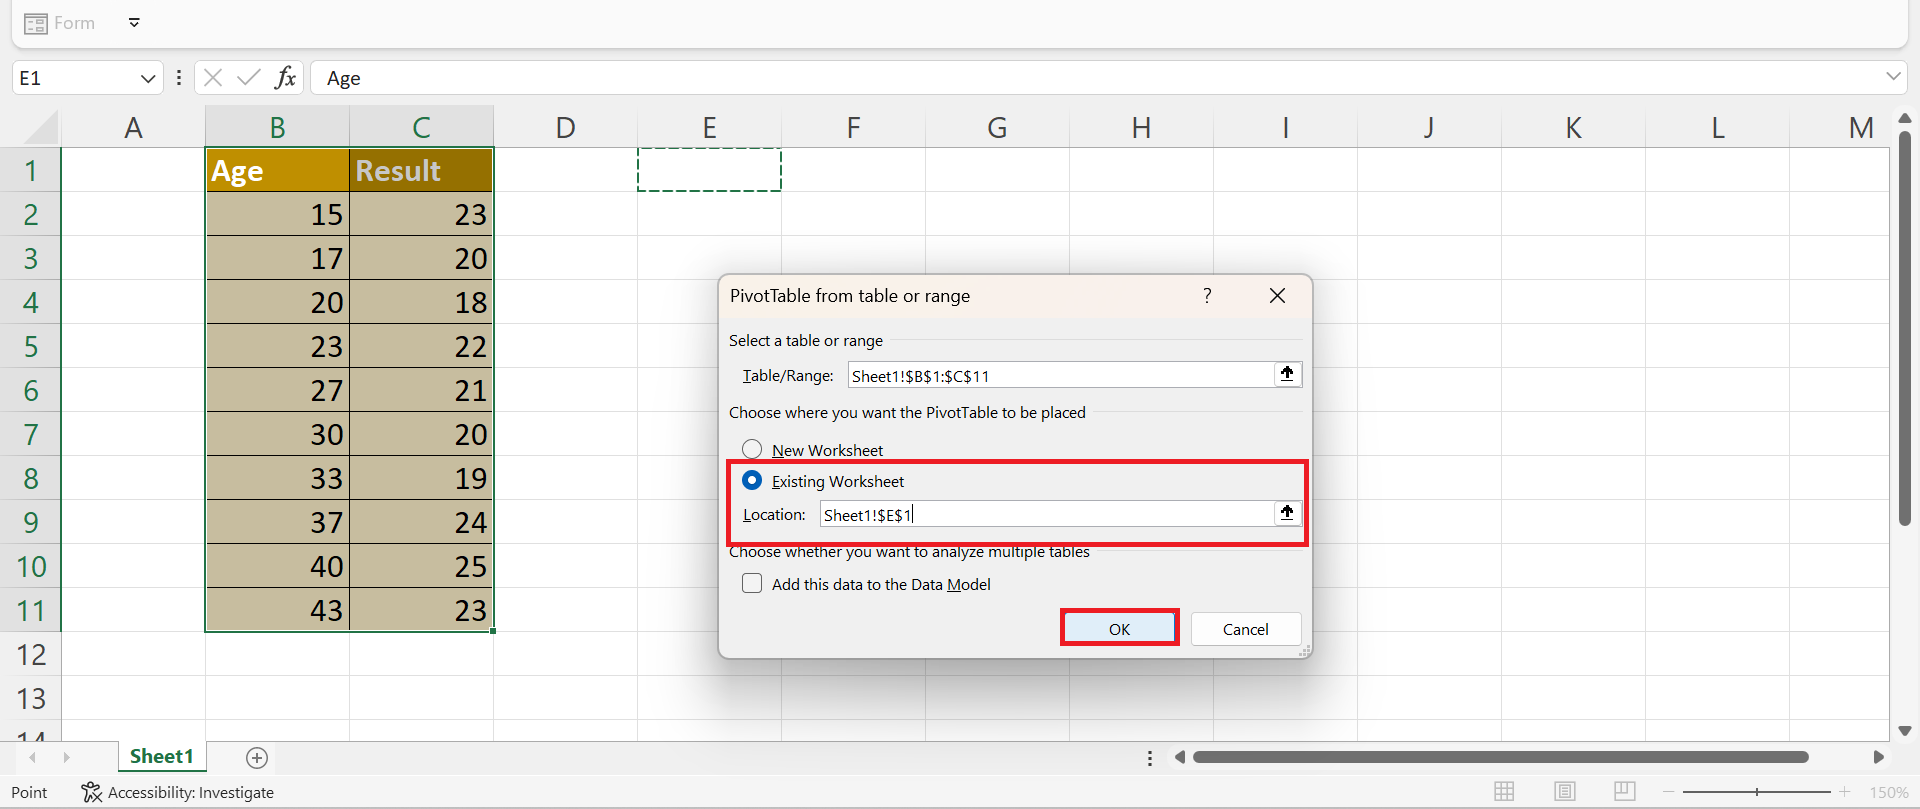
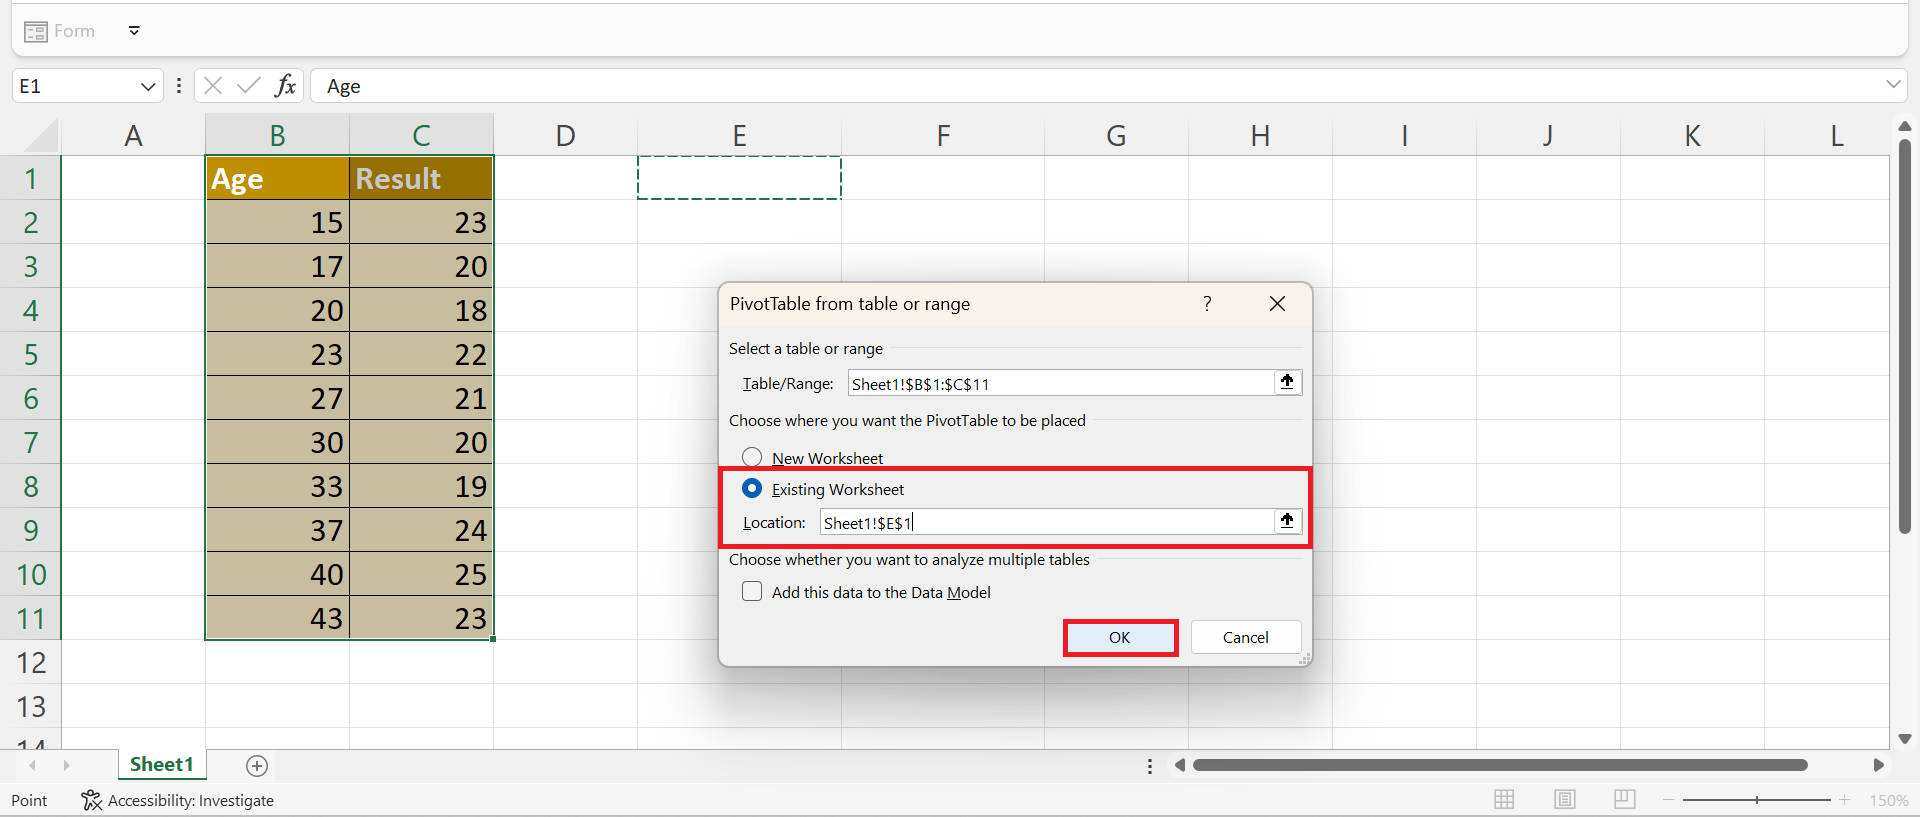
2. Secondly, we will choose the Existing Worksheet option in the PivotTable from table or range window. Then, we will input a new cell location to display our pivot table. Lastly, we will click OK to apply the changes.
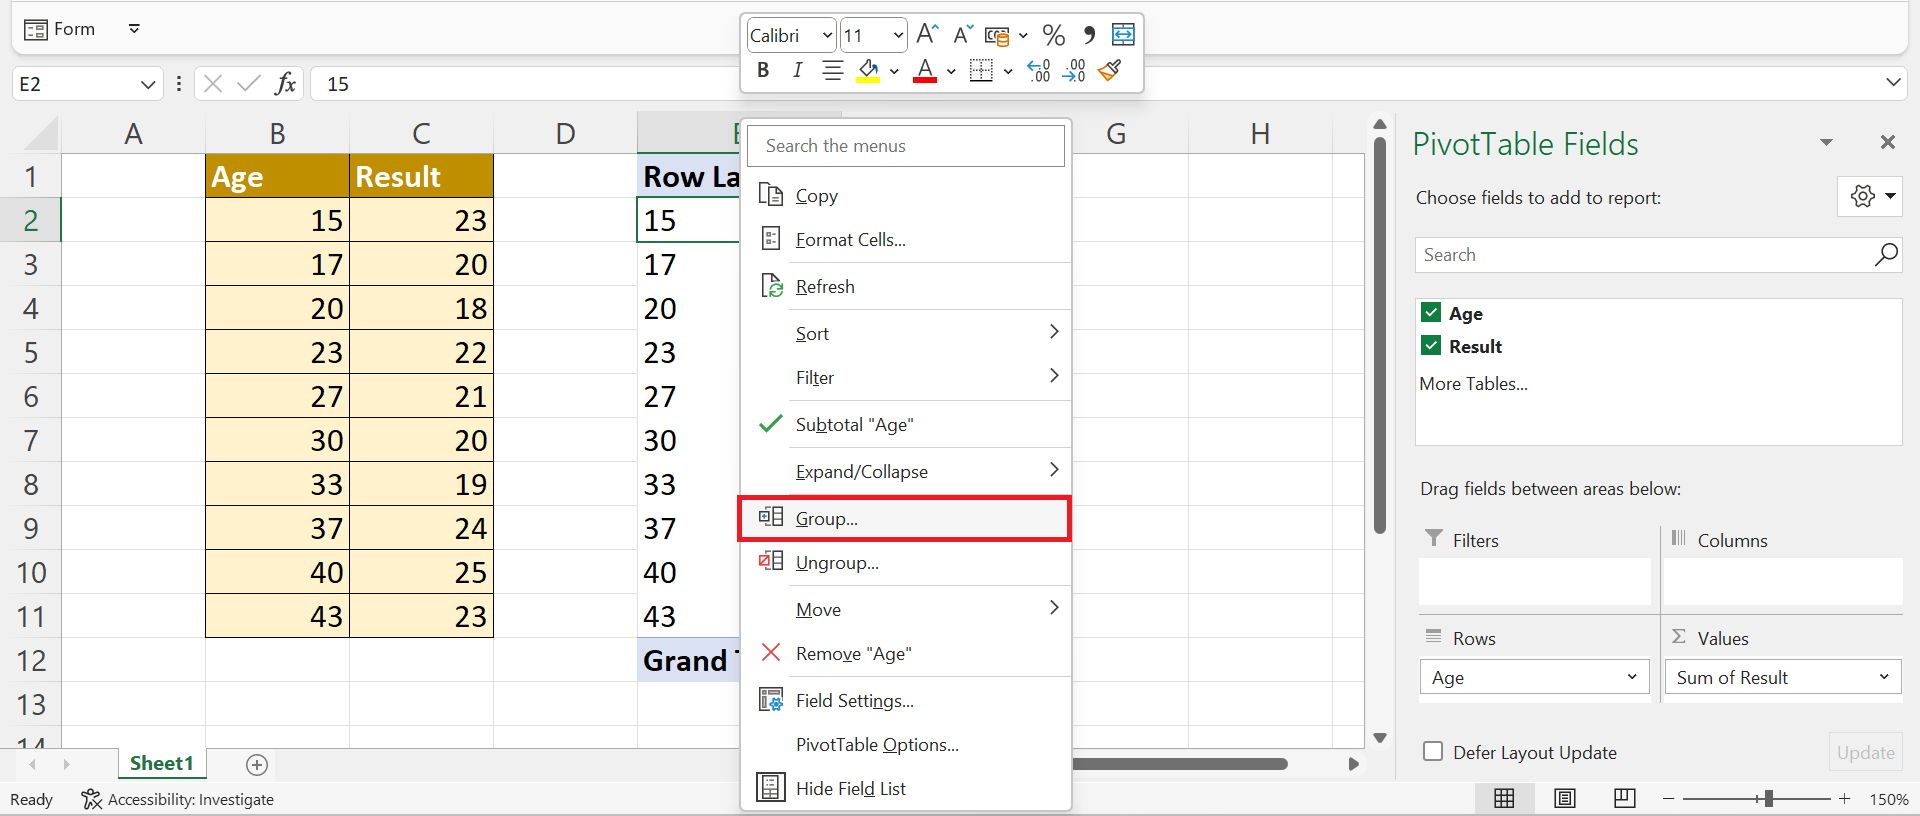
3. On the right side of the worksheet, the PivotTable Fields will open. So we will select the fields we want to display or add to our pivot table. In this case, we will check the boxes for Age and Result.

4. Then, we can now use the grouping method to group the values by ranges in the pivot table. To do this, we will simply select any cell in the pivot table and right-click. Next, we will click Group in the dropdown menu.
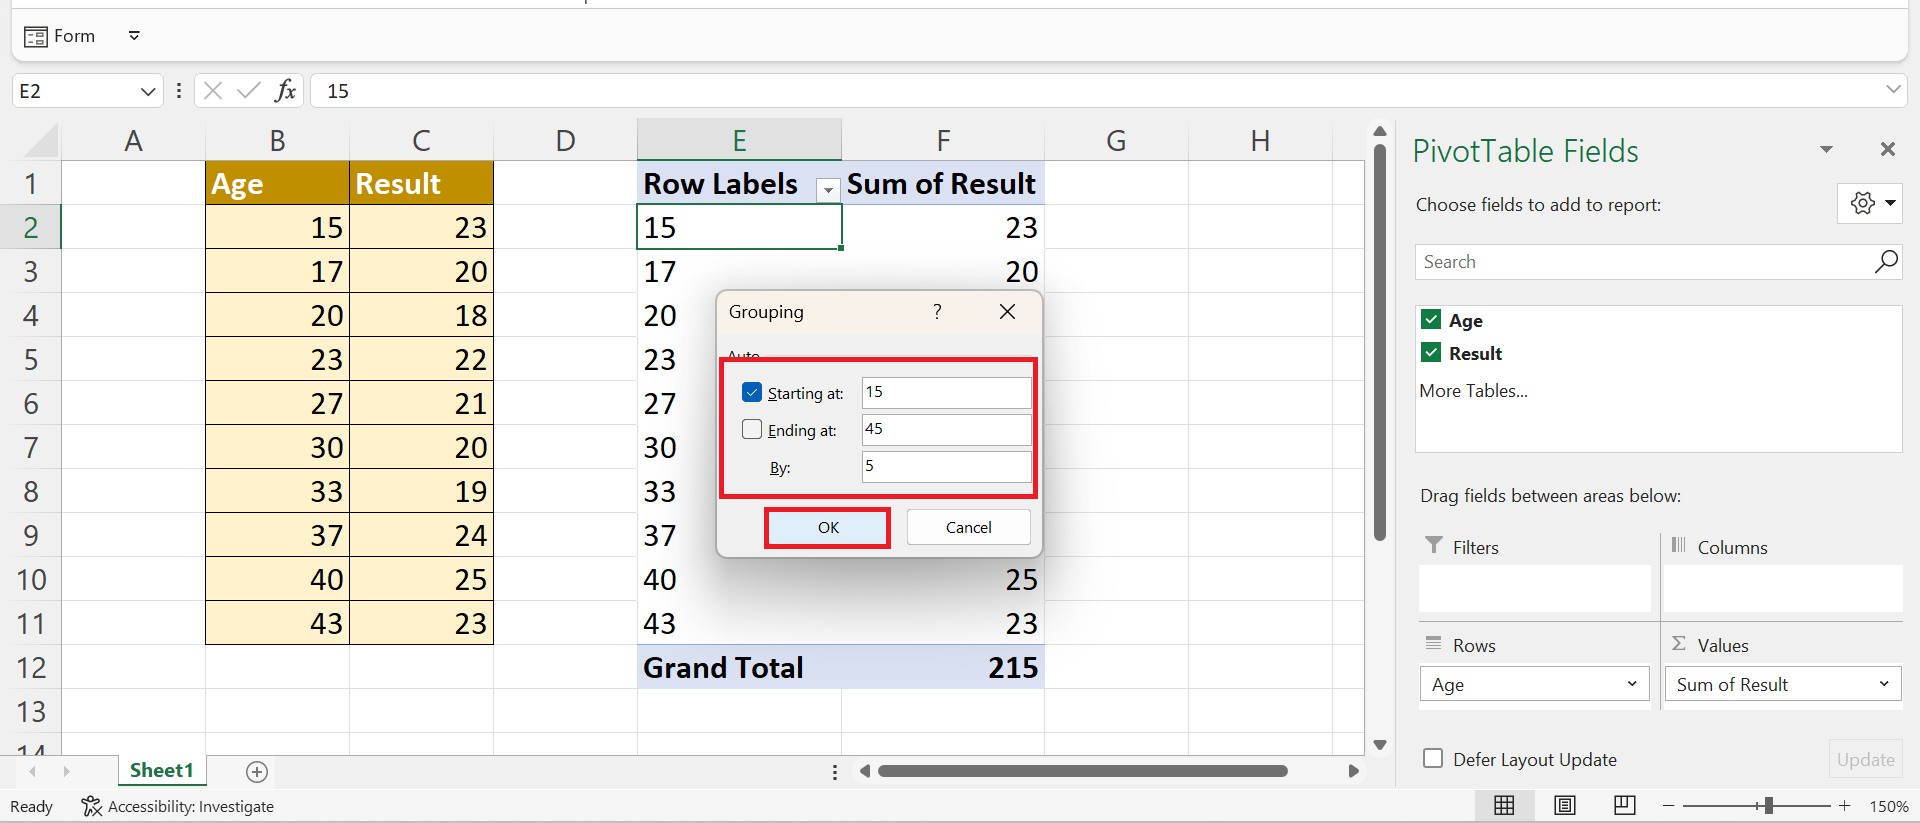
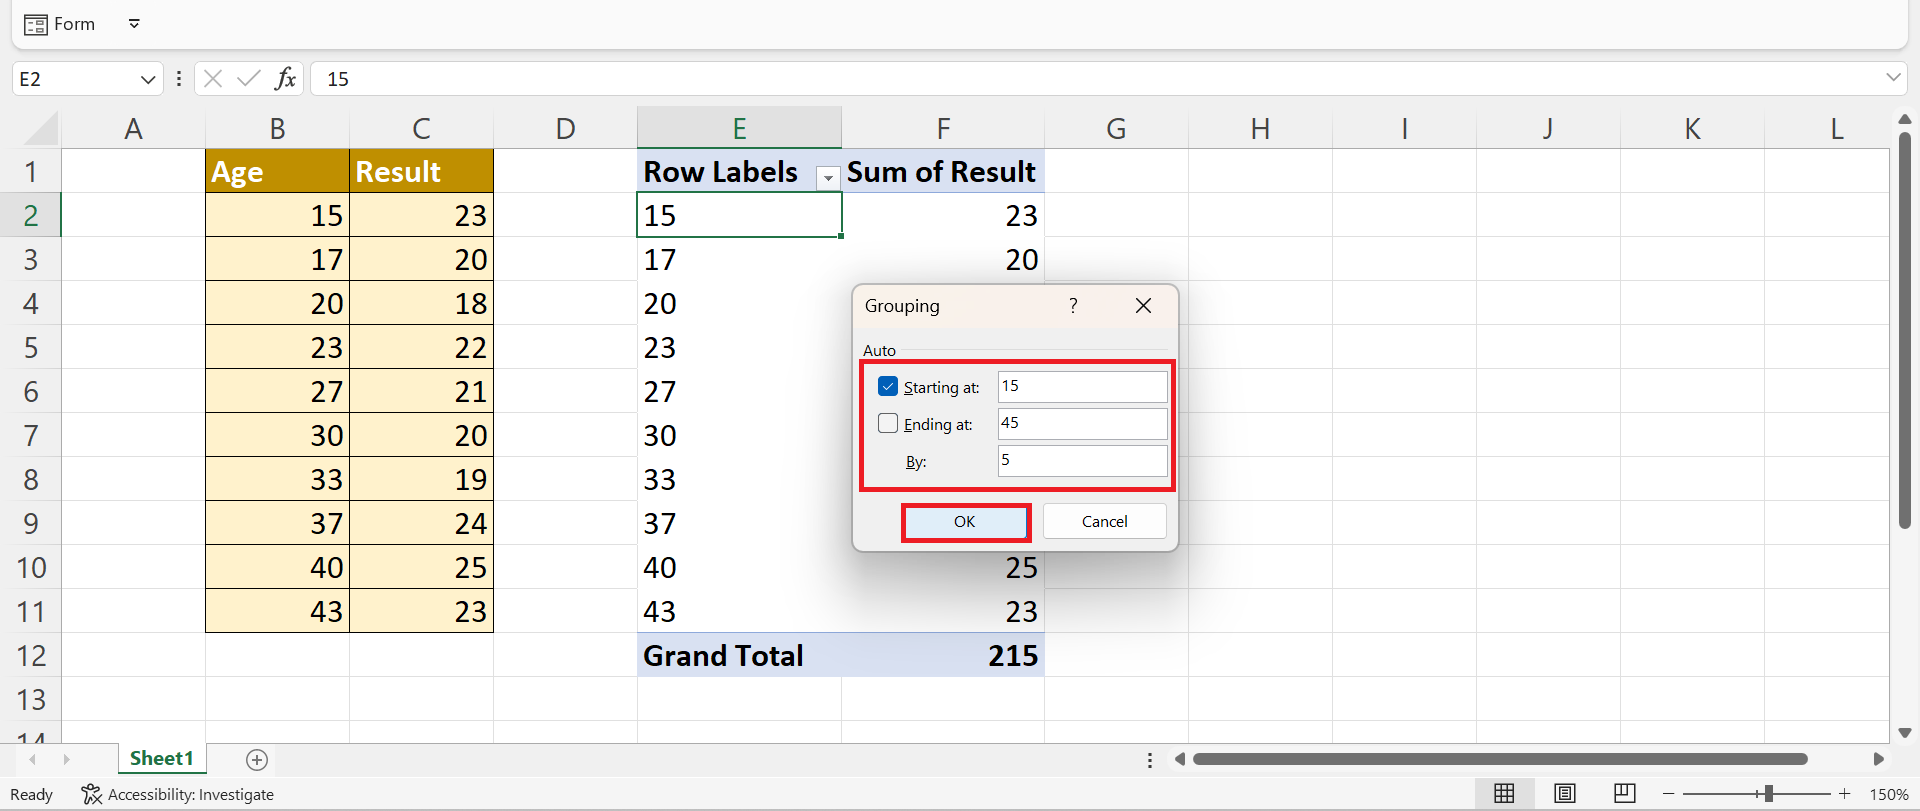
5. When the Grouping window opens, we will input our starting values, ending values, and intervals for our ranges. In this case, we will type “15” for Starting at and “45” for Ending at. Then, we will input “5” in the By space. Lastly, we will click OK to apply the changes.
6. And tada! We have successfully grouped values in a pivot table by range in Excel.
7. Alternatively, we can use another method to perform this task. Firstly, we will convert the data set to a pivot table. So we will select the entire data set and go to the Insert tab. Next, we will select PivotTable.
8. In the PivotTable from table or range window, we will choose Existing Worksheet and input an empty cell location to display the pivot table. Lastly, we will click OK to apply the changes.
9. Then, we will drag the Age field to Rows section and the Result to the Values section.

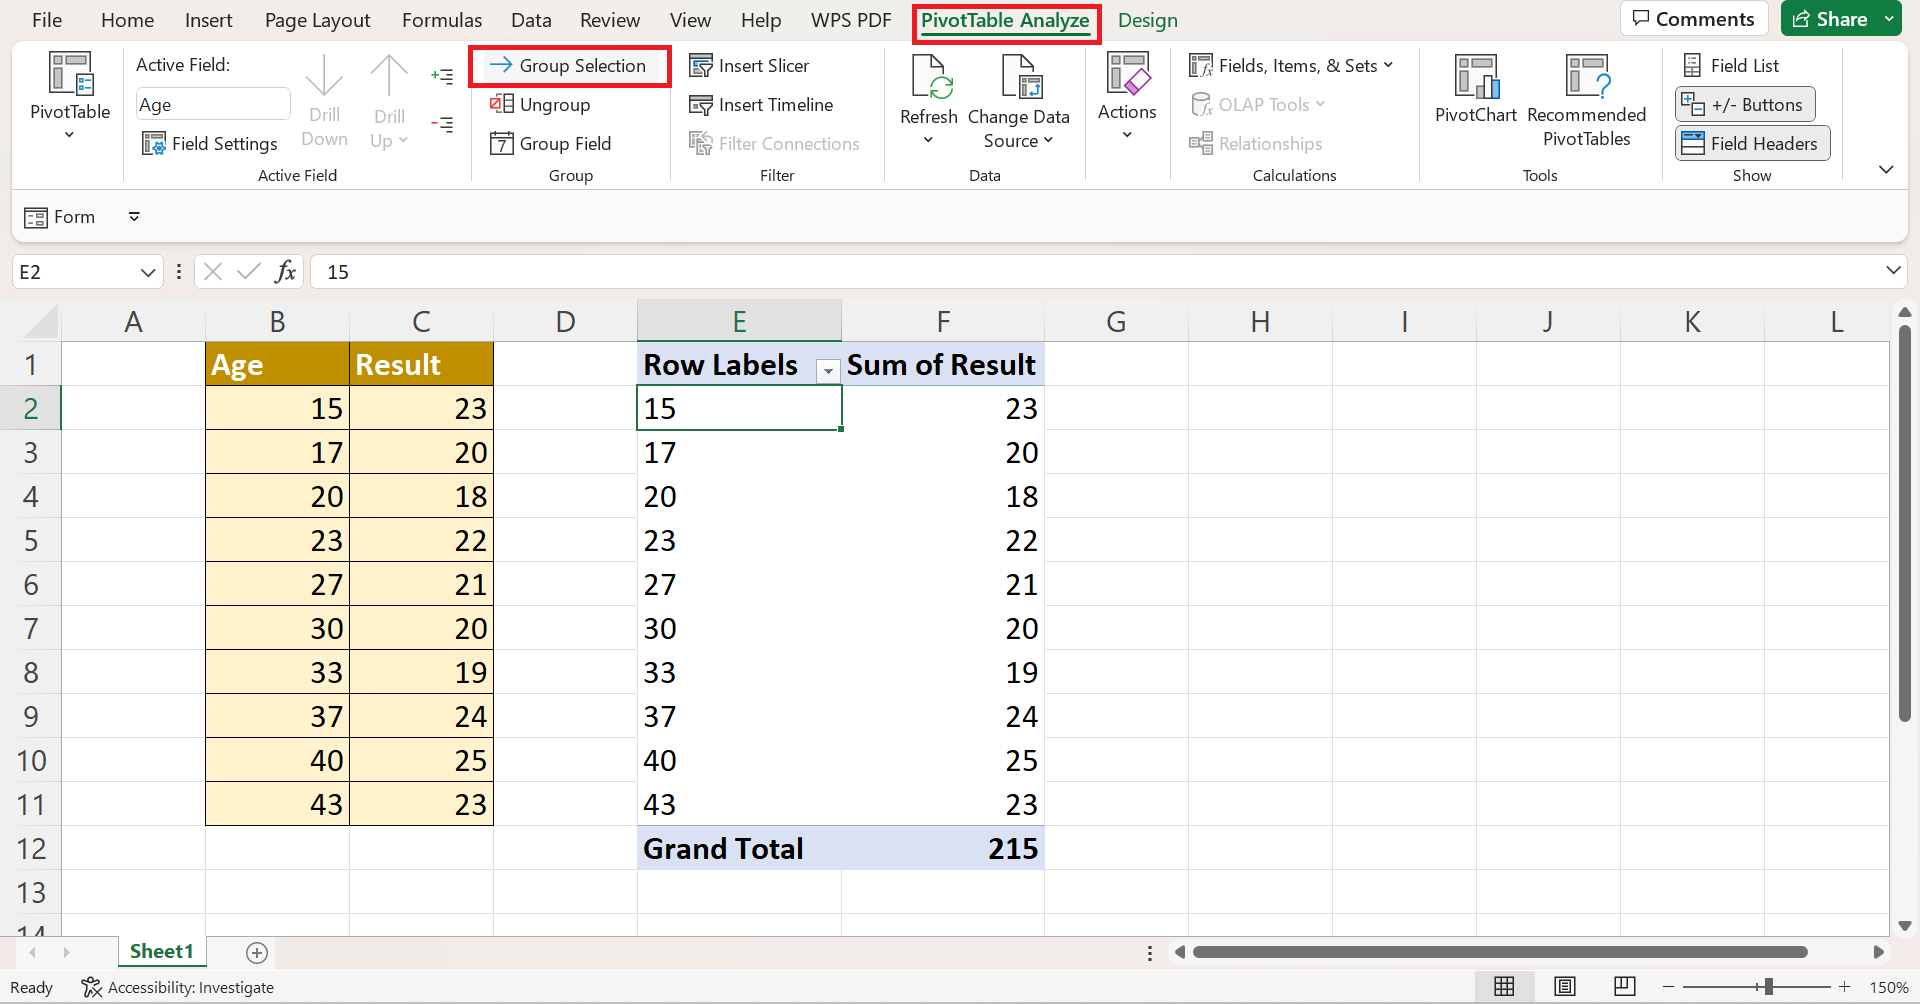
10. Afterward, we will go to the PivotTable Analyze tab and select Group Selection.
11. Once the Grouping window opens, we can input the same range values. For instance, we will type “15” as our Starting at and “45” as our Ending at. And we will input “5” as our By value. Lastly, we will click OK to apply the changes.
12. And tada! We have used another way to apply the grouping method of the pivot table to group values by range in Excel.
And that’s pretty much it! We have successfully explained how to group values in a pivot table by range in Excel. Now you can use this method and apply it to your work whenever you need to group values by range in a pivot table.
Are you interested in learning more about what Excel can do? You can now use the various other Microsoft Excel formulas available to create great worksheets that work for you. Make sure to subscribe to our newsletter to be the first to know about the latest guides and tutorials from us.


