This guide will explain how to calculate the economic order quantity in Excel.
Table of Contents
The economic order quantity (EOQ) is the ideal order quantity a business should purchase to minimize its inventory costs. Companies may also need to calculate the EOQ of a product to identify if investing in a larger order will allow them to cut down on shipment costs.
We can use a simple Excel formula to calculate the EOQ given the annual demand, order cost, and holding cost for the product. In this guide, we will provide a step-by-step tutorial on how to calculate the economic order quantity in Excel.
The Anatomy of the SQRT Function
The syntax of the SQRT function is as follows:
=SQRT(value)
Let’s look at each argument to understand how to use the SQRT function.
- value refers to the number for which to calculate the positive square root.
- The value argument must be positive. Negative input will result in a #NUM! Error instead.
A Real Example of Calculating the Economic Order Quantity in Excel
We can compute the economic order quantity using the following formula:
EOQ= SQRT(2*D*S/H)
Here are what each of the variables mean:
- D refers to the annual demand or sales for the given product.
- S refers to the order cost for each order. This cost often includes fees such as administrative costs and shipping fees.
- H refers to the holding cost for each unit. This cost takes into consideration storage fees, insurance, depreciation costs, and opportunity costs.
Let’s explore a simple use case where we’ll need to calculate the EOQ.
Suppose we are running a business that sells computer monitors. We want to determine the optimal number of monitors to buy in bulk to balance the cost of ordering and the cost of holding inventory.
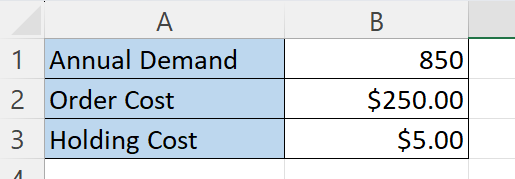
In the table above, we have written down a few important details about our computer monitor business. The annual demand (D) for our product is 850 units per year. Our order cost (S), regardless of size, will amount to $250 due to shipping fees. Our holding cost (H) value indicates that each unit will take approximately $5 to hold in an inventory for a year.
We can use the following formula to calculate the economic order quantity:
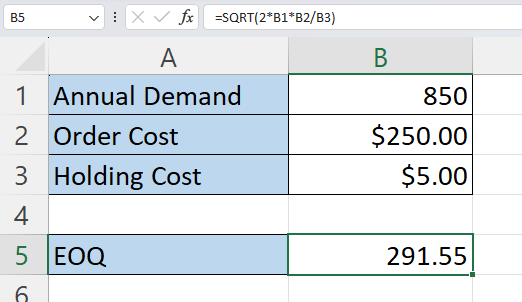
=SQRT(2*B1*B2/B3)
This formula uses the SQRT function to find the square root of the value 2DSH.
The calculated EOQ value from our formula is approximately 292 units. This suggests that we should order 292 computer monitors at a time to achieve the most cost-efficient balance between ordering and holding costs.
Click on the link below to create your own copy of our examples.
Head to the next section to read our step-by-step tutorial on how to calculate economic order quantity in Excel.
How to Calculate Economic Order Quantity in Excel
- We’ll need to input the necessary data into our spreadsheet.In the table above, we’ve set the annual demand to 850 units, the order cost to $250, and the holding cost to $5.
- Next, we’ll need to write down the EOQ formula in another cell.
 In this example, we’ll use the formula =SQRT(2*B1*B2/B3) in cell B5.
 - Hit the Enter key to evaluate the formula.
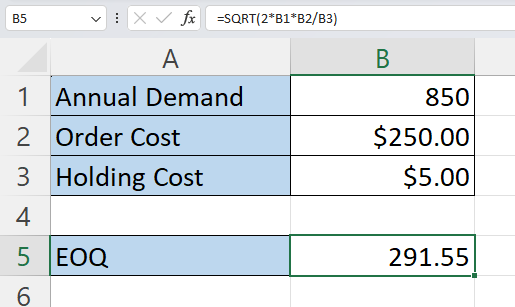
Our formula reveals that our economic order quantity is 291.55 units.
These are all the steps you need to take to calculate the economic order quantity for your business.
FAQs
- Why is the EOQ important in inventory management?
By determining the EOQ, businesses can find ways to reduce costs associated with excessive inventory storage, stockouts, or frequent order placements. Finding an optimal number of units to order ensures a more efficient and cost-effective inventory system. - What are the benefits of using the EOQ model?
The main benefit of using EOQ for your business is increased profitability. Using the suggested EOQ for a product will lower storage costs and allow businesses to save time and money making multiple orders to keep a product in stock. - Are there any limitations or assumptions related to the EOQ model
While the EOQ formula can help optimize your inventory management, there are some assumptions that are made to simplify the calculation. For example, the model assumes that the demand is constant throughout the period. Ordering and holding costs are also assumed to be constant.
To learn more about using Excel for inventory management, you can read our post on calculating safety stock.
That’s all for this guide! Be sure to check out our library of spreadsheet resources, tips, and tricks!