


The KURT function in Google Sheets is used for computing the kurtosis of a dataset, which is one metric for describing the shape of the distribution.
Kurtosis is a statistical measurement that defines how heavily the tails of distribution differ from the tails of a normal distribution. In simpler terms, it is a measure of the relative peakedness of a distribution.
The rules for using the KURT function in Google Sheets are as follows:
- The function requires one or more arguments that make up the population to measure.
- The function then outputs the kurtosis of the dataset.
- A positive kurtosis indicates a more peaked distribution, while a negative kurtosis describes a flatter distribution.
Let’s take a look at a quick example of where we can use the KURT function.
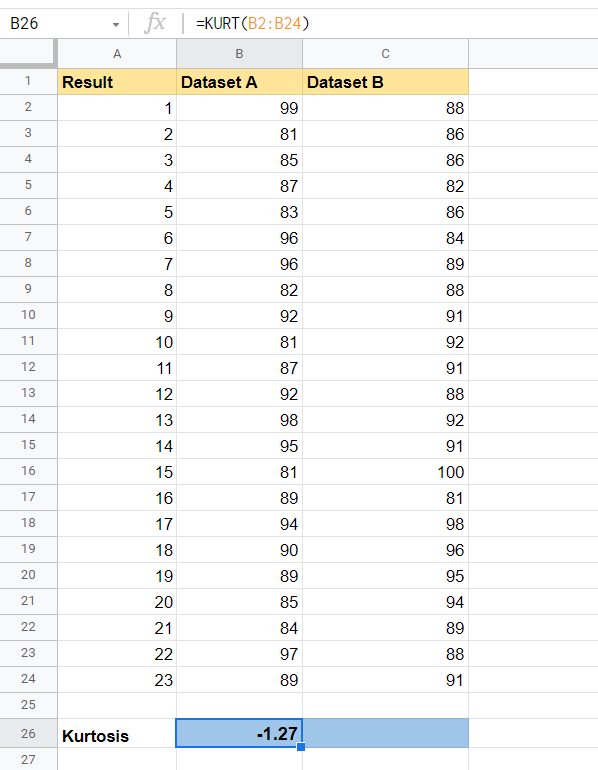
Let’s say we have two professors who teach Mathematics to high school students. Since they teach the same material, they agreed to use the same test for the final exam. Once the results came back, the principal of the school wanted to compare the results of both classes. Mainly the professor wants to know if there is a change in the distribution of scores.
With the KURT function, it becomes easy to see if the distribution is normal or if the distribution has a light-tail or heavy-tail.
You can use the KURT function to analyze the characteristics of any dataset’s distribution. For example, kurtosis can be used to assess the financial risk of a particular investment. Just note that the sample size of your dataset is important. A small sample size may show a kurtosis that’s not truly indicative of the real-life distribution of the population.
Now that we know when to use the KURT function, let’s dive into how to use it and work on an actual sample spreadsheet.
The Anatomy of the KURT Function
The syntax of the KURT function is as follows:
=KURT(value1, [value2, ...])
Let’s look at each term to understand what they mean.
- = the equal sign is how we start any function in Google Sheets.
- KURT() is our
KURTfunction. It computes the kurtosis of a given dataset. - value1 refers to the first value or range that is part of the dataset
- value2 refers to additional values that are part of the dataset.
- Text found in the arguments is ignored by the
KURTfunction.
A Real Example of Using KURT Function
Let’s look at a real example of the KURT function being used in a Google Sheets spreadsheet.
In the example below, we have two datasets of equal size. Using a Google Sheets chart, we can see that Dataset B has a more pronounced peak, with Dataset A being relatively flat. Using the KURT function, we can quantify this peakedness.

The second dataset is fairly close to 0, which means that it can be assumed to follow a normal distribution. Dataset A has a negative kurtosis, which implies that the distribution is flatter compared to a normal distribution.
To get the values in cell B26, we just need to use the following formula:
=KURT(B2:B24)
You can make your own copy of the spreadsheet above using the link attached below.
In the next section, we’ll look into how to start writing out the KURT function in Google Sheets.
How to Use KURT Function in Google Sheets
In this section, we will go through each step needed to start using the KURT function in Google Sheets. This guide will show you how to find the Kurtosis of the dataset shown in the example earlier.
Follow these steps to start using the KURT function:
- First, select the cell which will hold the result of our
KURTfunction. In this example, we’ll place our output in cells B26 and C26.

- For the next step, we just simply have to type in the equal sign ‘=‘ to begin the function, followed by ‘KURT(‘.
- The next step is to type in our dataset range as an argument. Afterward, simply hit Enter on your keyboard to evaluate the function.
- Lastly, we can drag the formula to the right to fill in the kurtosis value of the second dataset. As seen below, the second dataset is closer to a normal distribution because it is closer to 0.

Frequently Asked Questions (FAQ)
- Why does my formula return an error?
Make sure that there are at least two numerical values in the provided range. If the total number of numerical values supplied is less than two,KURTwill return the #DIV/0! error.
You have now read everything you need to know about the KURT function in Google Sheets. This function will definitely help if you want to understand the distribution of a range of values.
You can now use the KURT functions in Google Sheets together with the various other Google Sheets formulas available to create powerful worksheets that fit your use case.
Make sure to subscribe to our Google Sheets newsletter to be the first to know about the latest guides and tutorials from us.


