The T.INV function in Google Sheets is useful when you need to calculate the negative inverse of the T.DIST function.
We often use the Student t-distribution when encountering data sets with a small sample size. This distribution tends toward a normal distribution when we increase the sample size.
The rules for using the T.INV function in Google Sheets are as follows:
- The function requires two arguments: probability and degrees of freedom.
T.INVoutputs the negative inverse of theTDISTfunction.
In statistics, we can use the t-distribution to estimate the mean of a population where the sample size is small, and the standard deviation is unknown.
Like the normal distribution, the t-distribution is symmetric and bell-shaped. The t-distributions have a higher kurtosis than a normal distribution. Since the t-distribution has longer tails, the probability of getting values far from the mean is larger than a normal distribution.
We might need the inverse of this function when computing for confidence intervals for a dataset modeled with the t-distribution. We can also use it to find critical values for one-tailed and two-tailed tests.
Let’s look at a scenario where we can use the T.INV function.
We want to perform a right-tailed test with a dataset of size 10. We are given an alpha of 0.05, which corresponds to a 95% confidence level. What are the critical values of this test?
We need to find a point in the distribution that separates the top 5% from the bottom 95%. We can use the T.INV function to compute this point for us.
Before we dive into a real example, let’s learn how to write the T.INV function ourselves in Google Sheets.
The Anatomy of the T.INV Function
The syntax of the T.INV function is as follows:
T.INV(probability, degrees_freedom)
Let’s take a look at each term and understand what they all mean.
- = the equal sign is how we start any function in Google Sheets.
- T.INV() is our
T.INVfunction. This function calculates the negative inverse of the one-tailedTDISTfunction. - probability refers to the probability associated with the t-distribution. This value must be between 0 and 1.
- degrees_freedom refers to the number of degrees of freedom used in the calculation. This value must be greater than or equal to 1.
- Both arguments to
T.INVmust have a numeric value.
A Real Example of Using T.INV Function
Let’s look at a real example of the T.INV function being used in a Google Sheets spreadsheet.
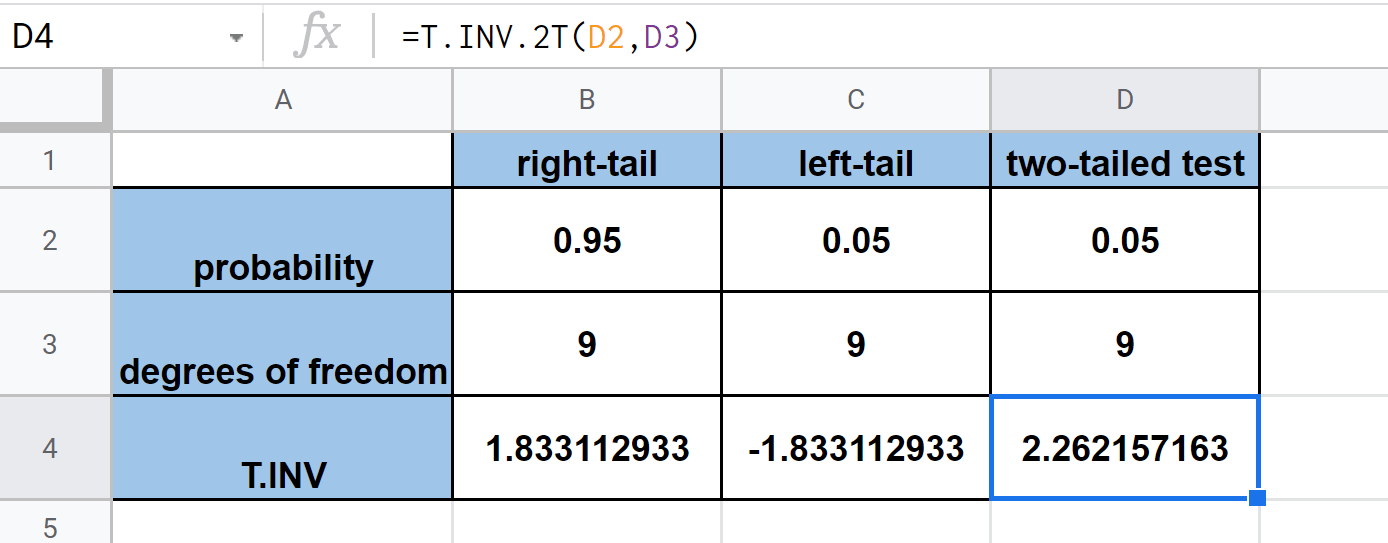
In the example below, we have a table that tries to find critical values for different kinds of tests. We set a confidence level of 95% and derive 9 degrees of freedom from our sample size of 10.
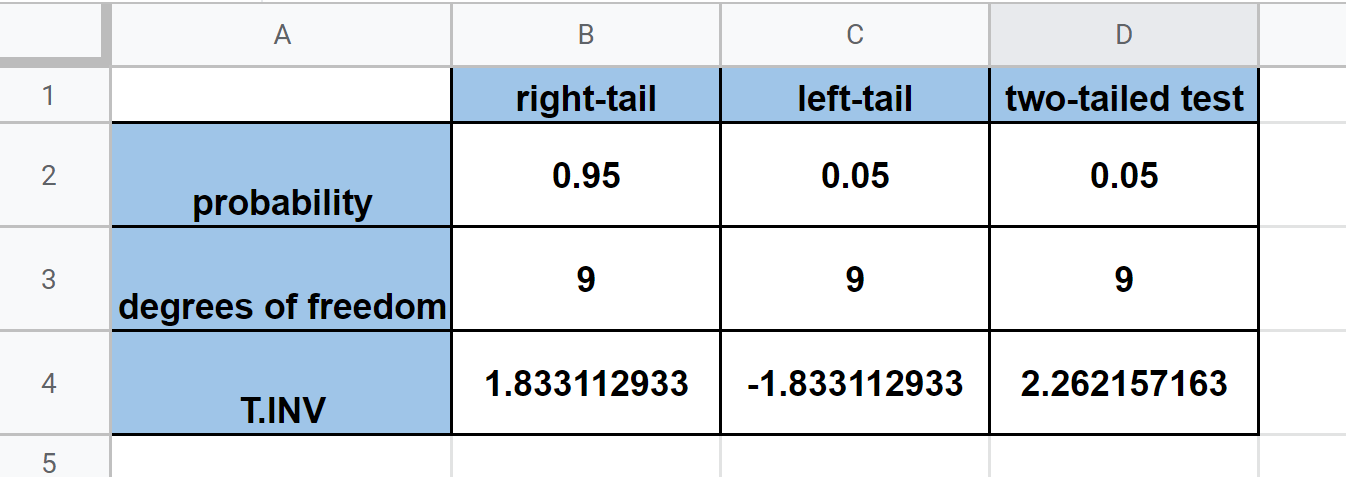
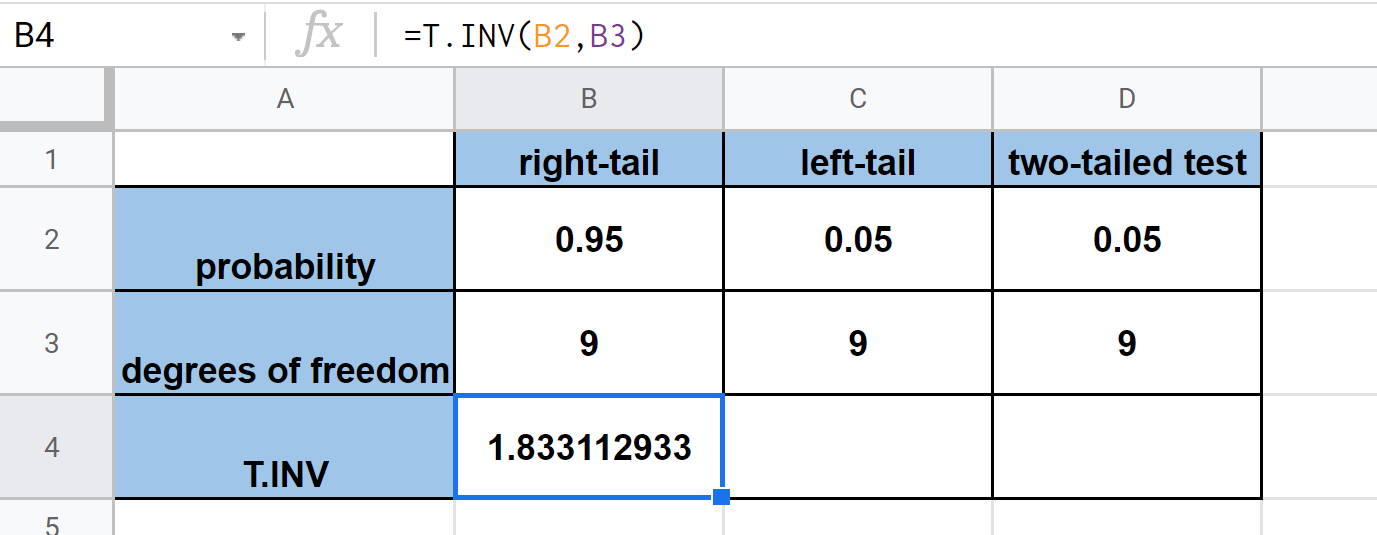
To get the value in cell B4, we just need to use the following formula:
=T.INV(B2,B3)
You can make your own copy of the spreadsheet above using the link attached below.
If you’re ready to try out the T.INV function in Google Sheets, let’s begin writing it ourselves!
How to Use T.INV Function in Google Sheets
This section will guide you through each step needed to start using the T.INV function in Google Sheets. You’ll learn how we can use the inverse function of the t-distribution to find the critical values for one-tail and two-tailed tests.
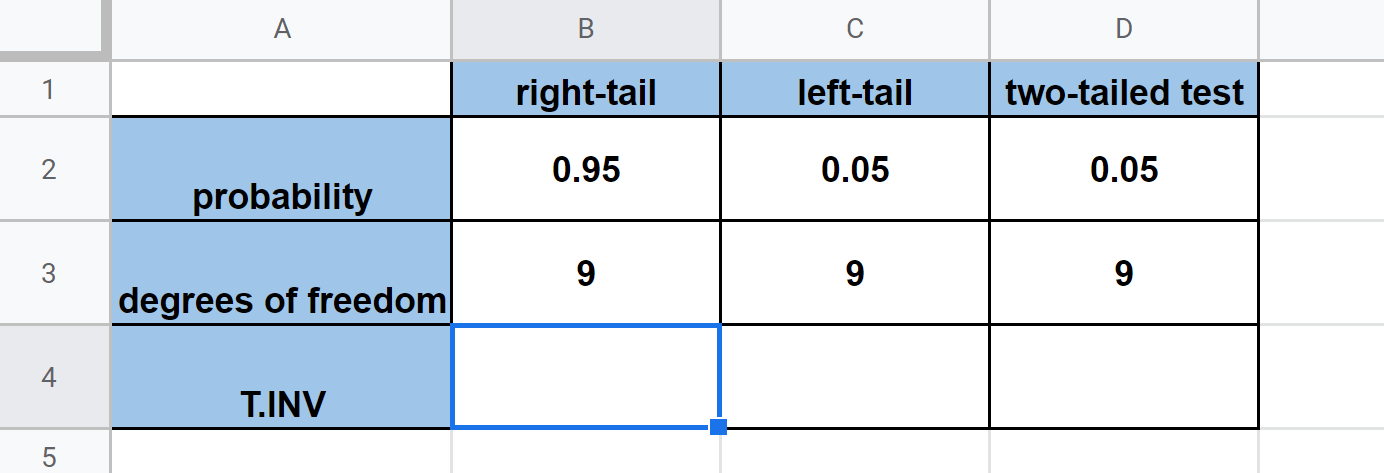
- First, let’s select the cell which will hold the result of our
T.INVfunction. In this example, we’ll first place our function in cell B4.
- Next, we can simply type the equal sign ‘=‘, followed by ‘T.INV(‘. If we want to use the two-tailed option, we can type in ‘T.INV.2T(‘ instead.
- Typing the full function name leads to a tooltip box to appear with hints on how to use the
T.INVfunction. Click on the arrow on the corner if you need to minimize it.

- The next step is to type in our two arguments: probability and degrees of freedom. These values can be found in their respective rows in the table provided. After hitting the Enter key, we now know that the critical value for our right-tail test is 1.833.
- The left-tail test has a similar procedure. However, this time we get the complement of the probability of the left-tail test. This is computed as 1 – 0.95 = 0.05. This gives us a critical point value of -1.833.

- Lastly, we can select the two-tailed test by using the ‘T.INV.2T’ variation of the formula.
Frequently Asked Questions (FAQ)
- Why does my formula return an error?
Non-numerical values in your arguments will result in a#VALUE!error. Keep in mind that the degrees_of_freedom must be at least 1. Invalid integers will return a #NUM! error.
That’s all you need to remember to start using the T.INV function in Google Sheets. This detailed guide shows how quickly we can find the inverse of the Student t-distribution.
The T.INV function is just one example of a statistical function you can use in Google Sheets. With so many other Google Sheets functions out there, you can surely find one that suits your use case.
Are you interested in learning more about what Google Sheets can do?
Make sure to subscribe to our newsletter to be the first to know about the latest guides and tutorials from us.