The VARA function in Google Sheets is useful when you need to calculate the variance of a sample dataset.
The variance is calculated by getting the sum of the squares of each value’s deviation from the mean and divides by the total number of values minus one.
The rules for using the VARA function in Google Sheets are as follows:
- The function requires at least two values in the form of specified values or ranges.
- The function then outputs the variance of the provided sample values.
First, let’s understand what we mean by variance.
Variance refers to the numerical value that shows how spread out the data points in a dataset are from the mean. A variance of zero means that all the data is equal to the mean. A greater variance means that values are more spread out.
In statistics, we can get the variance of either the population as a whole or just a sample of that population. To compensate for lack of information, sample variance is slightly higher.
Population variance follows the formula Σ(xi-x-)/n where n is the number of items. Computing the sample variance is similar, but it subtracts 1 from the denominator n.
Let’s look at a specific use case to use the VARA function.
Let’s say we have two species of tree. Our dataset has a size of 200 with 100 different data points for both species. Our main concern is to know the average height (mean) of the trees and the sample variance.
With the VARA function, it becomes a straightforward calculation to find the sample variance for each species.
This use case is just one way to use the VARA function in Google Sheets. The variance calculation can also help with making decisions in personal and business finance, economics, and social studies.
Now that we know when to use the VARA function, let’s learn how to write it in Google Sheets.
The Anatomy of the VARA Function
The syntax of the VARA function is as follows:
=VARA(value1, [value2, ...])
Let’s look at each term to understand what each of them means.
- We use the equal sign “=” to start any function in Google Sheets.
- VARA() is our
VARAfunction. It calculates the variance based on a sample. - value1 refers to the first value or range of the sample.
- value2 refers to the additional values or ranges to include in the sample.
- The
VARAfunction supports an arbitrary number of arguments. VARAconsiders all text values as 0 when calculating. If you want text values to return an error, you can use theVARfunction instead.- Remember that we use
VARAwhen handling a sample of a population. If you’re working with the entire population, you may want to use theVARPAfunction instead.
A Real Example of Using VARA Function
Let’s look at a real example of the VARA function being used in a Google Sheets spreadsheet.
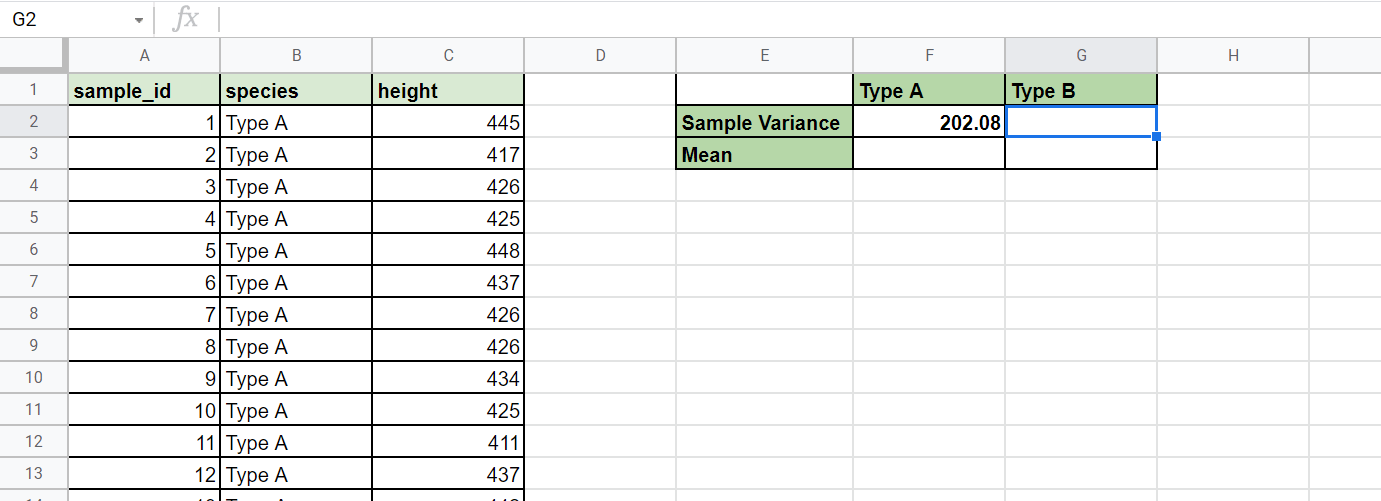
In the sample table below, we have a dataset in range A1:C102 which describes the heights of two different species of trees: Type A and Type B. Using the AVERAGE function, we were able to compute the mean of both species. Using the VARA functions, we were also able to get the sample variance of each type of tree.
Note that we use the FILTER function to filter out each range by species before computing the mean and sample variance.

To get the sample variance of Type A, we just need to use the following formula:
=VARA(FILTER(C2:C101,B2:B101 = F1))
You can make your own copy of the spreadsheet above using the link attached below.
Let’s begin writing it ourselves! In the next section, we’ll look into how to use the VARA function step-by-step.
How to Use VARA Function in Google Sheets
This guide will show you how to get the variance of a sample dataset using the tree height data shown earlier.
Follow these steps to start using the VARA function:
- Select the cell where we’ll place our
VARAresult. In this example, we’ll fill in the sample variance entry under the Type B column.
- Next, we just have to type the equal sign ‘=‘ to begin the function, followed by ‘VARA(‘.
- You may see a tooltip box with information on using the
VARAfunction. Click on the arrow in the top-right-hand corner of the box to minimize it if needed.
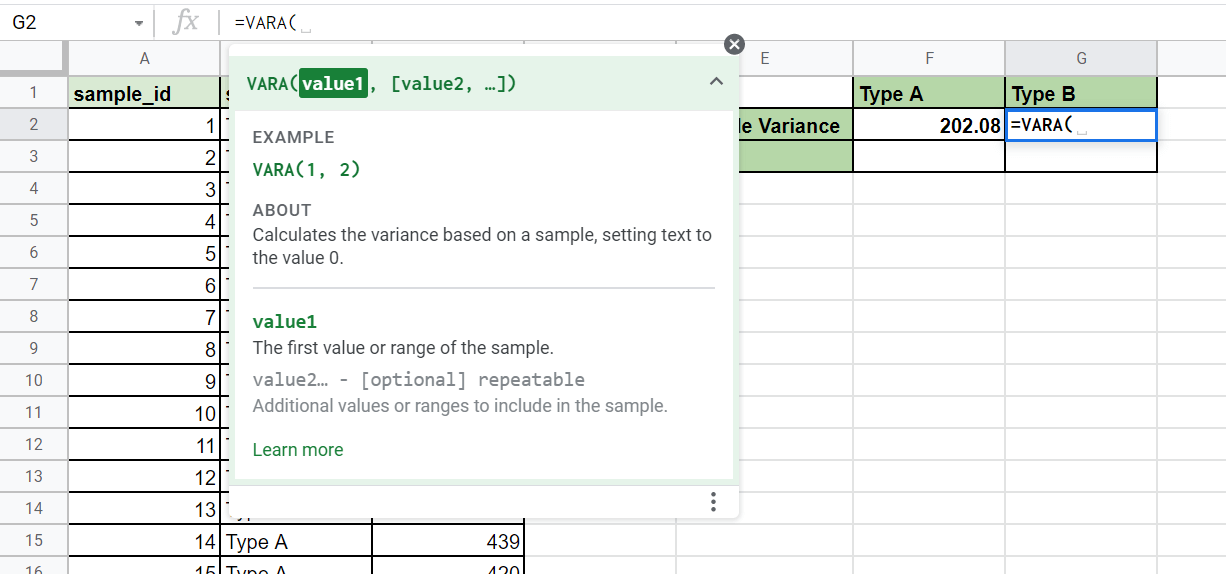
- Next, we need to specify the range of our sample dataset. We can use the
FILTERfunction to get the data points in rows where the species is “Type B”.
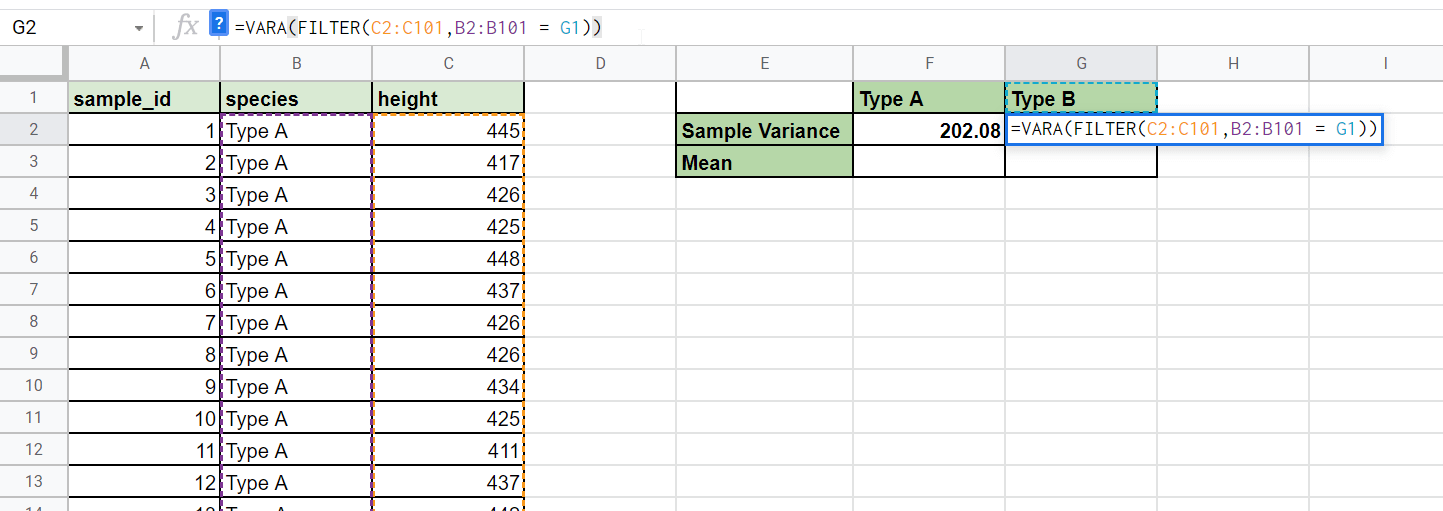
Afterward, we can hit Enter on the keyboard to let the function evaluate. Now we know that the variance in the height of species of Type B is 3420.53, which is higher than the variance of Type A. This means that the heights of Type B trees are much more spread out from the mean than those of
other species.
Frequently Asked Questions (FAQ)
- How does the VARA function compute for variance?
TheVARAfunction simply takes the sum of the squares of each value’s distance from the mean. We then divide the sum by the number of total values minus one. - Why does my formula return an error?
Make sure that the dataset contains at least two numbers. If the total number of values is less than two,VARAwill return a#DIV/0!error.
This step-by-step guide shows you how easy it is to find the sample variance of a given dataset.
You can now use the VARA functions in Google Sheets together with the various other Google Sheets formulas available to create powerful worksheet solutions.
Make sure to subscribe to our Google Sheets newsletter to be the first to know about the latest guides and tutorials from us.