


The Z.TEST function in Google Sheets is useful when you want to compare the mean of a sample dataset against the population mean.
Z.Test functions help determine whether there is a relationship between two particular variables.
Table of Contents
The rules for using Z.TEST in Google Sheets are as follows:
- You must first have an array or range that holds your dataset and a test statistic to compare with the said dataset.
- The
Z.TESTwill return a p-value which shows how likely it is that your sample population mean is statistically different from the overall population. - Generally, the
Z.TESTis used for datasets of at least 30 samples.
Let’s look at a quick example.
Say you heard a claim that people who grew up with a library of books in their home have a higher IQ on average. As a curious statistician, you want to prove that there is a relationship between the presence of a library and someone’s IQ.
Let’s assume that it’s already known that the average IQ is 100 and that the standard deviation is about 15. In your research, you were able to have thousands of respondents take an IQ test. An additional questionnaire was then provided to determine how many books they had as a child. With all this data now available, how do we go about testing out the claim?
The Z.TEST is a quick and reliable way to check if any such relationship exists. We just need to plug in the IQ scores of your sample and test it against the overall population’s average mean IQ of 100. If the value returned is very low (usually ≤ 0.05), then it’s highly likely there is a relationship between IQ and the presence of books.
The output of our Z-test is known as a p-value, or probability value. This metric describes how likely it would be for the result to have happened by random chance. To put it simply, if the Z-test returns a low p-value, then there is a statistically significant relationship between two variables.
We can use the Z.TEST all kinds of data. For example, we can use the Z.TEST to test the effectiveness of a medical treatment on people of a certain age. Another use case would be to measure the impact of legislation on different sectors of the population. Anytime we’re comparing a sample mean with the population’s we can use a Z-test to see if there is a significant difference.
Now that you know what the Z.TEST function is all about, let’s learn how to write it ourselves in Google Sheets and later use a test dataset to see this function in action.
The Anatomy of the Z.TEST Function
So the syntax (the way we write) the Z.TEST function is as follows:
=Z.TEST(data, value, [standard_deviation])
Let’s dissect this thing and understand what each of these terms means:
- ‘=‘ the equal sign is just how we start any function in Google Sheets.
- Z.TEST() is our
Z.TESTfunction.Z.TESTwill return the one-tailed P-value of a Z-test assuming a standard distribution. The lower the value returned, the more likely it is that the differences between the sample mean and population mean is valid. - data refers to the array or range containing the dataset to consider.
- value refers to the test statistic provided for this Z-test.
- standard_deviation is an optional argument that refers to the standard deviation to be assumed for the z-test. If none is provided, Google Sheets will compute STDEV() using the provided dataset.
A Real Example of Using the Z.TEST Function
Take a look at the example below to see how the Z.TEST function is used in Google Sheets.
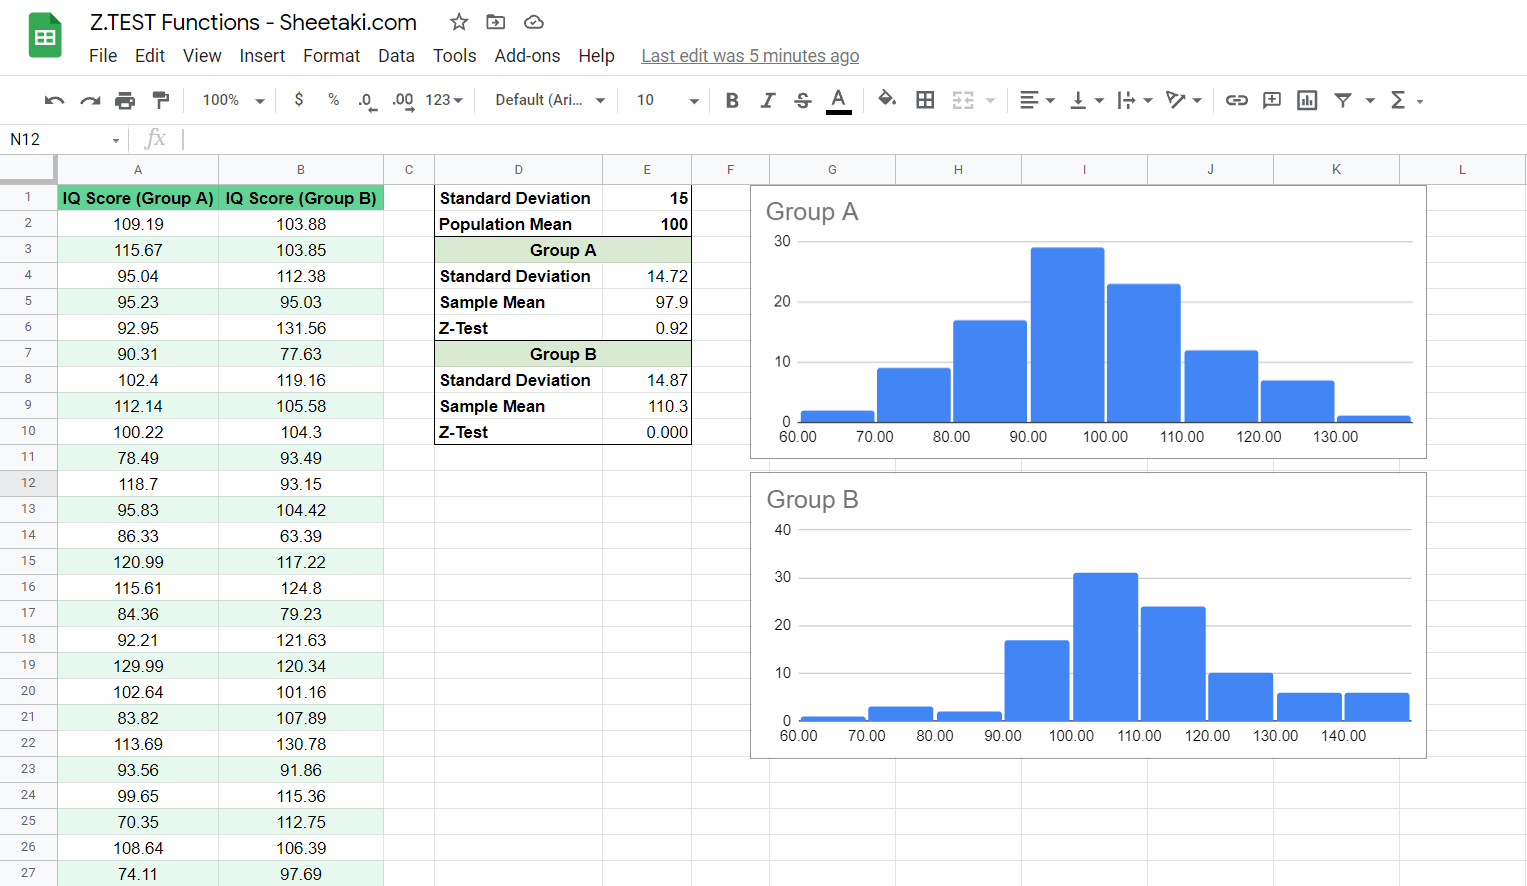
Here we have two sample datasets of IQ scores. In this particular example, let’s say the data was collected from a town of 10,000 people. Group A is a random sample of 100 people from this town. Group B is another random sample of 100 people but from the pool of people who have had a library in their own home.
Looking at the histogram on the right, it’s not so apparent if Group B performs better on the IQ test. But using the Z-test function we can see that Group B has a much more significant difference than Group A.
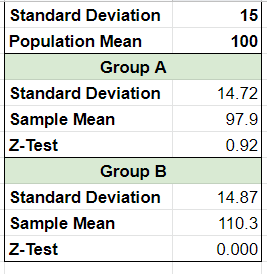
Remember, the lower your p-value is, the more likely it is that your result is not caused by randomness. You can see that the Z-test result for Group B is less than our alpha value of 0.05, which is a good sign that our variable (having a library at home) affects IQ.
You may make a copy of the spreadsheet using the link I have attached below.
We should note that a Z-test works best when the dataset follows a normal distribution. Generally, the Z-Test is most useful when the standard deviation is already known.
Great! Let’s begin writing our own Z.TEST function in Google Sheets.
How to Use Z.TEST Function in Google Sheets
- Before we type our function, let’s populate our table with a dataset. For this example, we will continue to use IQ scores.
We’ve also set up a quick summary table with some statistics we already know. In this case, our population standard deviation and mean are given.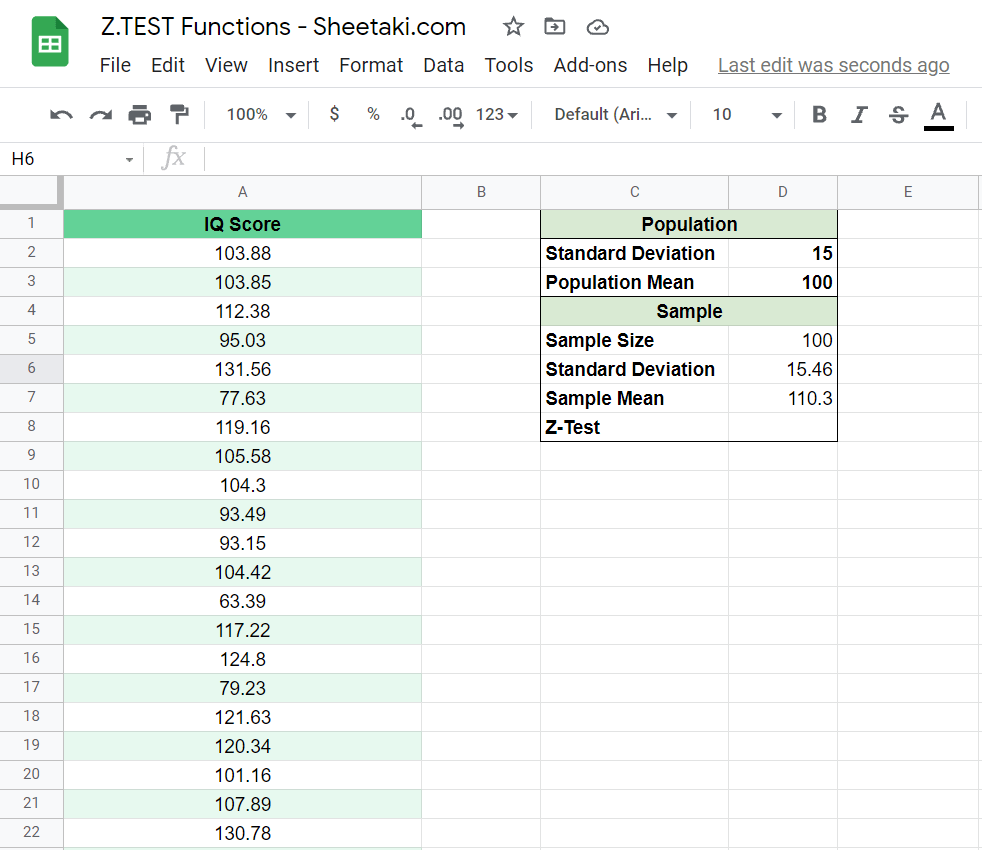
- To start using
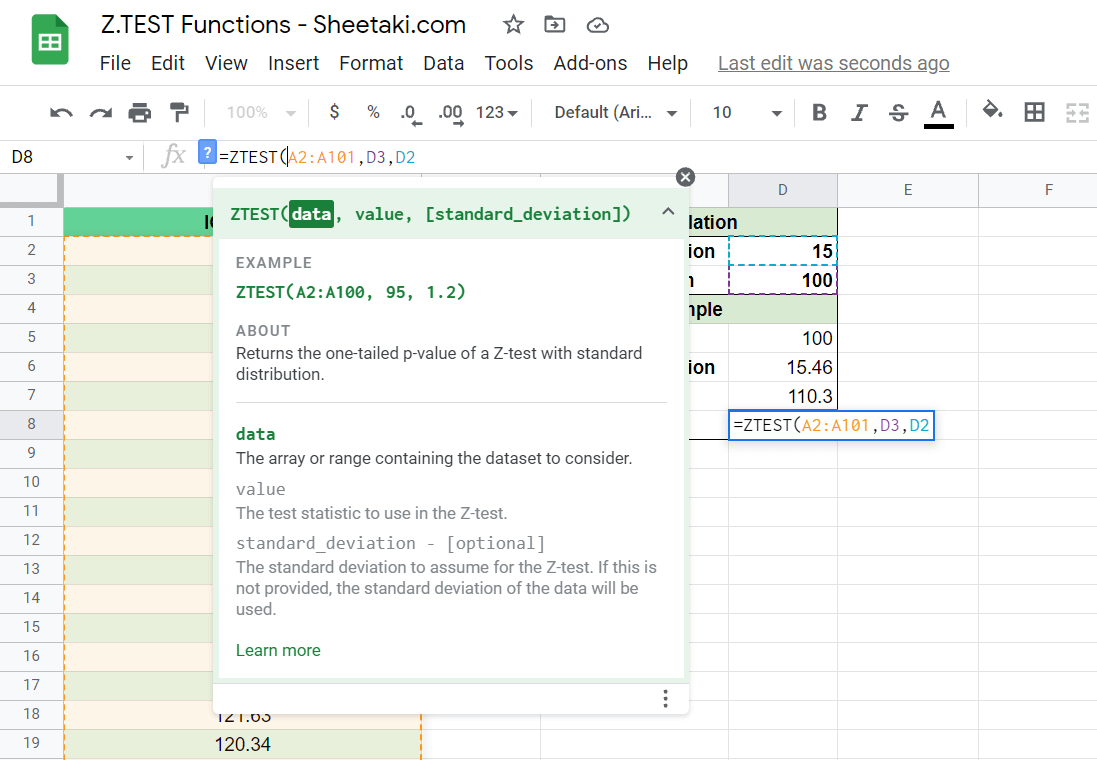
Z.TEST, we should select a cell to make it the current active cell. For this guide, cell D8 will be where we will input our function’s result. - Next, simply type the equal sign ‘=‘ to begin the function, followed by the name of the function we’ll be using which is ‘Z.TEST‘.
- You should find that the auto-suggest box shows you the
Z.TESTfunction even before fully typing it out. You may press the Tab button on your keyboard to let Google Sheets auto-fill your Formula Bar with ‘Z.TEST‘. - Let’s type out the arguments we need to compute the Z-test score. In this example, we want to select the range A2:A101 for our data, D3 for our value, and D2 for our standard deviation. Afterward, simply hit Enter on your keyboard to let the function evaluate.
- We did it! Our
Z.TESTreturned a significantly low p-value, which means it’s very likely that your sample would have a higher mean than the population’s.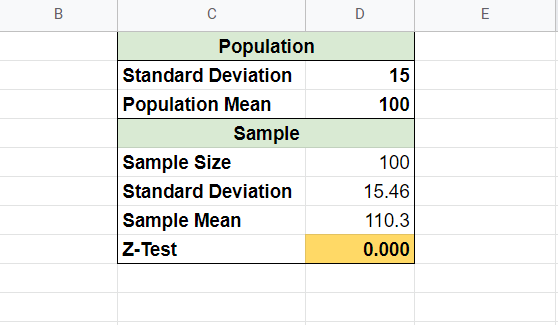
That’s pretty much all you need to know about the Z.TEST function. Hopefully, this step-by-step guide has made it easy for you to figure out how to validate your hypotheses given a sample dataset.
You can now use the Z.TEST functions in Google Sheets together with the various other Google Sheets formulas available to create more powerful worksheets for your convenience.
Do consider subscribing to our newsletter to be notified of more helpful Google Sheets guides like this one.


