In this guide, you will learn not only how to add a chart but how to edit the chart legend in Google Sheets, as well. Charts are useful to extract data out of Google Sheets and help gain insight just by glancing at it.
Table of Contents
Since visual images are much better perceived by an audience than just endless columns and rows of numbers, you should place a chart inside your Google Sheet. This will help your audience easier understand your data.
Spreadsheets are widely used and quite useful for storing, manipulating, and analyzing data but it’s much easier to gain insight when looking at a beautifully illustrated pie chart or line graph than a list of numeric information.
Whether you want to gain insight at your monthly expenses or visually represent the number of visitors at a venue, with Google Sheets you can easily create a chart of your own.
But how do we do that?
Simple. Google Sheets, as well as other spreadsheets programs, has a built-in feature that will help you add a chart and edit the chart legend, as well.
Let’s go straight into real examples where we will deal with actual data that will help you better understand how to add chart and edit the legend in Google Sheets and see how you can create it yourself.
Real Examples of Different Chart Types in Google Sheets
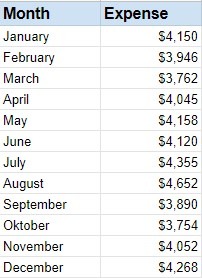
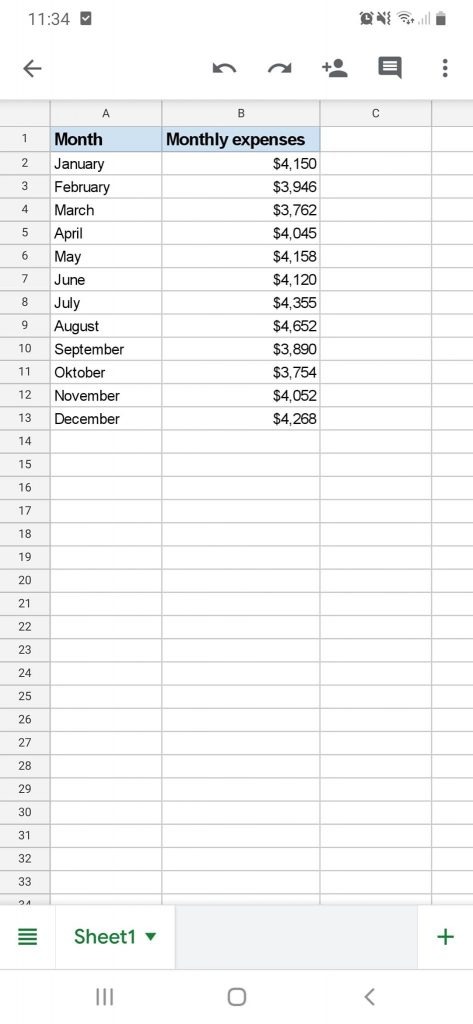
Let’s say we have a list of our monthly expenses and would want to create a visual representation that will help us gain insight into the data just by looking at it briefly. The picture below shows our monthly expenses throughout the year 💰📅
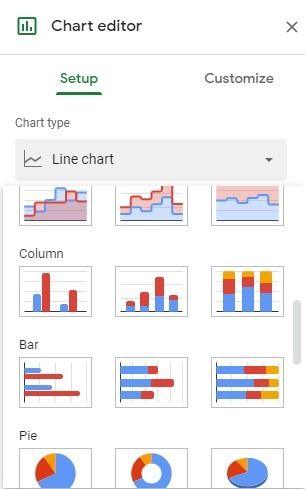
Let’s take a look at the example below to see some different chart types available in Google Sheets:

If you take a look at the picture, you will see four different chart types – Line chart, Column chart, Bar chart, and Pie chart. As you can see, not all chart types are suitable for all data (sometimes you even would not be able to use a certain chart type – for example, we cannot use the Bubble chart to visually represent our monthly expenses since it requires at least three columns and we only have two).
The chart editor will suggest chart types that the software thinks would work best with your data, and although it is a good start, you should still experiment until you find the one that suits you.

How to Add A Chart in Google Sheets
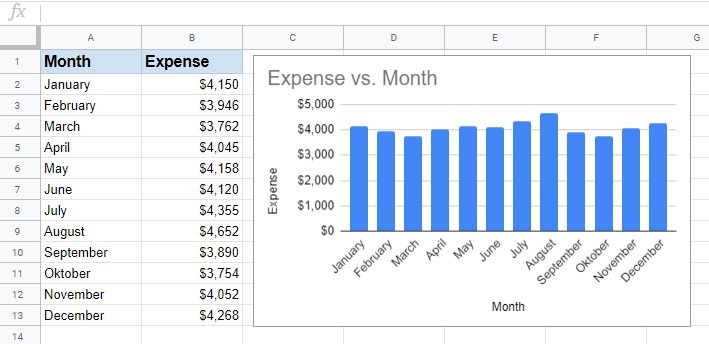
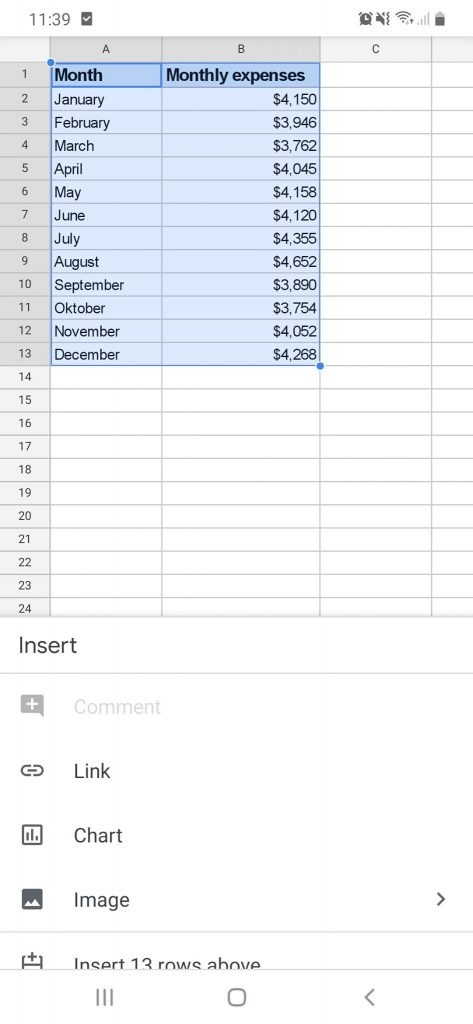
- To add a chart in Google Sheets, we must first specify the data for our chart to be based on. In this guide, I will use our monthly expenses. Select the range by clicking on the first cell and drag your cursor until you cover all the data your chart will be based on. For this guide, I will select the range A1:B13.

- Now that you have chosen your data, go to the upper menu and select Insert > Chart.

- This will open the ‘Chart editor’ toolbar on the right.

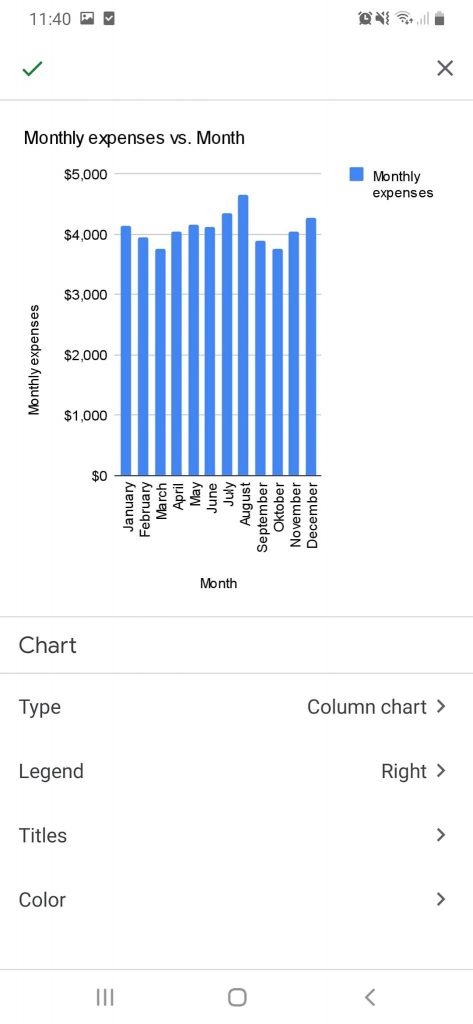
- Google Sheets will automatically create a chart based on your data and suggest a few other chart types, as well.
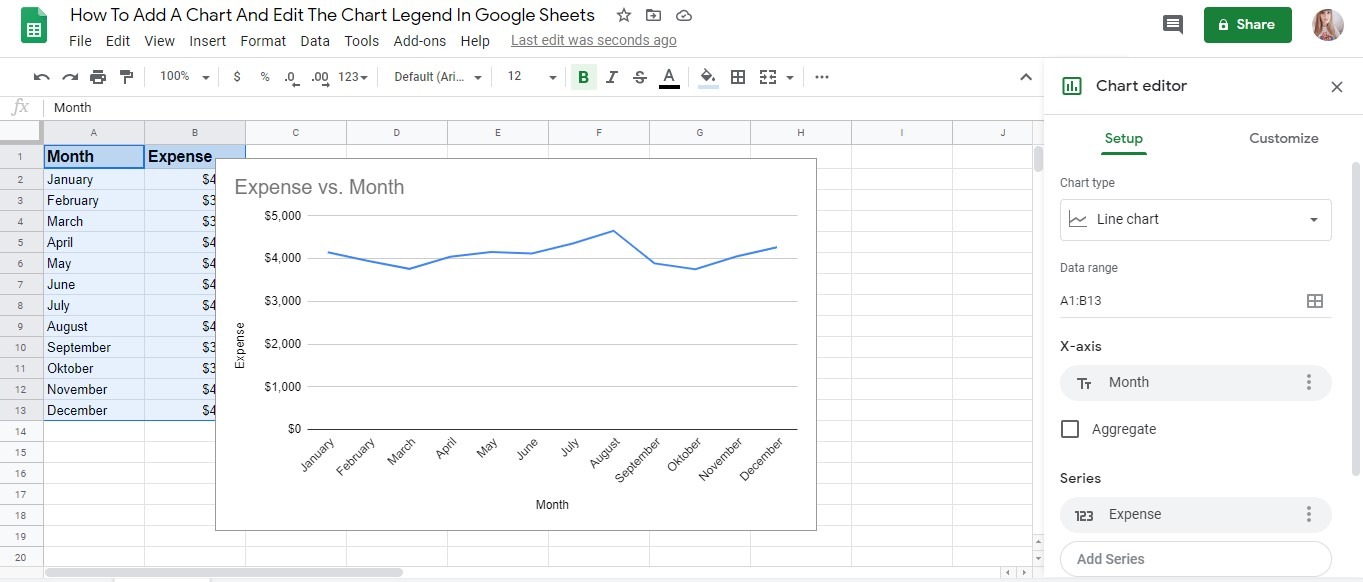
- To choose a different chart type, click on the drop-down list below the ‘Chart type’ and choose the chart type you want to use. For this guide, I will choose a Column chart.
- If you are satisfied with how your chart looks, that is it, you are done! However, if you are not completely satisfied and would want to modify your chart, you should click on the tab that says ‘Customize’.
- Depending on the chart type you have selected, you will be able to make different customizations, such as editing your chart style (font, background and border colour), chart & axis titles (text, font, size, format, and colour), gridlines (major and minor gridline count and colour), and more.

- Once you are done modifying your chart, click the ‘X’ in the upper right corner of the chart editor to close the toolbar, and simply drag the chart to where you want to place it in Google Sheets. You can change the size of your chart just how you would resize any other image, by clicking on it and dragging one of its corners or sides.
How To Edit The Chart Legend In Google Sheets
When you add a chart, you will most likely want to edit the chart legend. The chart legend is the coloured box with text that tells the reader what each colour used on the chart represents.
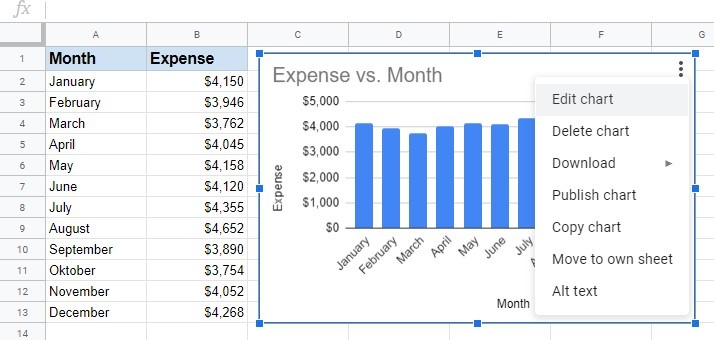
- To edit the chart legend, you should go to the ‘Chart editor’ toolbar (to open it, click on the chart, click on the three dots in the upper right corner, and choose ‘Edit chart’ from the list).
- Go to the ‘Customize’ tab, and there you will find the ‘Legend’ section. Click on it.

- Now you can change the position of your chart’s legend, as well as the legend font, font size, format, and colour. You can see that the position of my chart legend is set to ‘None’. For the chart legend to appear, we should choose one of the available positions (top, bottom, left, right, etc).
- Once it appears, the chart legend will automatically update as you make changes within the editor. To save your edits, simply click on the ‘X’ in the upper right corner of the ‘Chart editor’ toolbar.
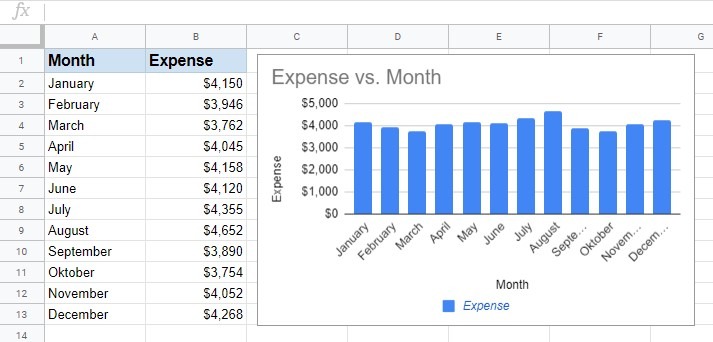
You may have noticed that the only part of the legend we did not change is the text displayed for the legend. To edit the chart legend text, we would have to rename the data column. I will replace the ‘Expense’ with ‘Monthly expenses’. The chart will automatically update.

How to Add a Chart on Google Sheets App on Android
When you are on the go, you can access your sheet from the phone using the Google Sheets App.
- Open the Google Sheets App and click on the sheet you want to use.
-
- Select the data (tap the first cell and drag the bottom blue dot until you cover all the data your chart will be based on), and click on the + button at the top menu. This will open the Insert menu at the bottom part of the screen.
- Choose ‘Chart’. You can then change your chart type and edit the chart legend position, as well as titles and colours.
- To add a chart, click on the checkmark in the upper left corner of the screen. You can now move or resize your chart.
That’s pretty much it when it comes to adding the chart and editing the chart legend in Google Sheets. You can try it yourself by making a copy of the example spreadsheet using the link attached below:
Now, when you now know how to add a chart and edit chart legend in Google Sheets, you can learn how to use various other Google Sheets formulas to sort and filter your data so you can create even more powerful charts. 🙂