This guide will explain how to calculate the stock to sales ratio in Excel.
When we want to measure the value of our inventory against the value of our sales for a specific period of time, we can easily do this by calculating the stock to sales ratio in Excel.
Repetitive calculations can be made efficient by automating them in Excel. This will allow us to simply change certain values instead of manually performing the formula every single time.
Stock to sales ratio is a common concept in business that refers to a financial ratio that determines the amount of inventory a company has on hand compared to the number of sales it has generated over a specific period of time.
Calculating the stock to sales ratio involves many steps and initial calculations before getting the final result. Fortunately, Excel makes it easier to calculate the stock to sales ratio using its built-in functions.
In this guide, we will provide a step-by-step tutorial on how to calculate stock to sales ratio in Excel. Furthermore, we will explore the formula and a real example of using the function.
Great! Let’s dive right in.
The Anatomy of the Stock to Sales Ratio Formula
The stock to sales ratio can be calculated by dividing the value of the average inventory held during a particular period of time by the value of sales generated during the same period.
We can calculate the stock to sales ratio using the formula:
=average inventory/net sale
However, we first need to calculate the average stock value, gross sales, and net sales before we can calculate the stock to sales ratio.
Now let’s take turns understanding each term in the formula.
Average stock value refers to the sum of the product’s beginning inventory and the ending inventory then dividing the sum by 2. In addition, the beginning inventory and ending inventory are computed by multiplying each stock by the production unit cost.
The formula for average stock value is as follows:
=beginning inventory/ending inventory/2
Gross sale is the grand total of all sales made over a particular period of time. However, this does not include the cost of sales or returns.
The formula for gross sales is:
=(beginning inventory/ending inventory)*selling price
Net sales refer to the total revenue a company earns from the sale of its goods or services after subtracting any deductions such as discounts, returns, or allowances.
The net sales formula is as follows:
=(gross sales-sales return)*selling price
A Real Example of Calculating Stock to Sales Ratio in Excel
Let’s say we have a company that sells stationery products. The most popular product is the planner which is why we want to calculate the stock to sales ratio of this product.
We need to prepare all the necessary information about the product such as the beginning stock, ending stock, production unit cost, the selling price per unit, and the sales return to calculate the stock to sales ratio.
Our initial data set would look like this:

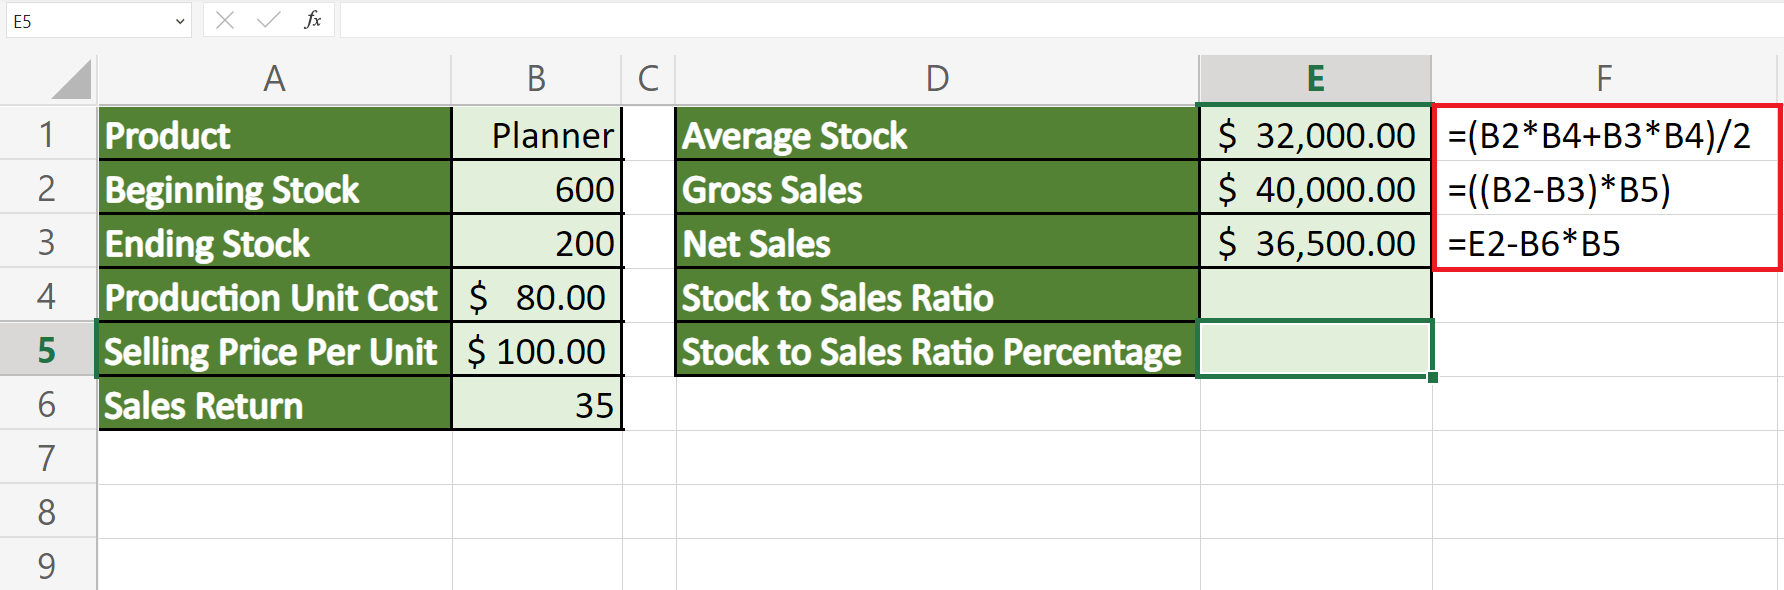
In the spreadsheet above, all the necessary information about the product is given. Before we can calculate the stock to sales ratio, we first need to calculate the average stock, gross sales, and net sales.
Firstly, we can calculate the average stock value using the formula =beginning inventory/ending inventory/2. In our formula, this will be =(B2*B4+B3*B4)/2
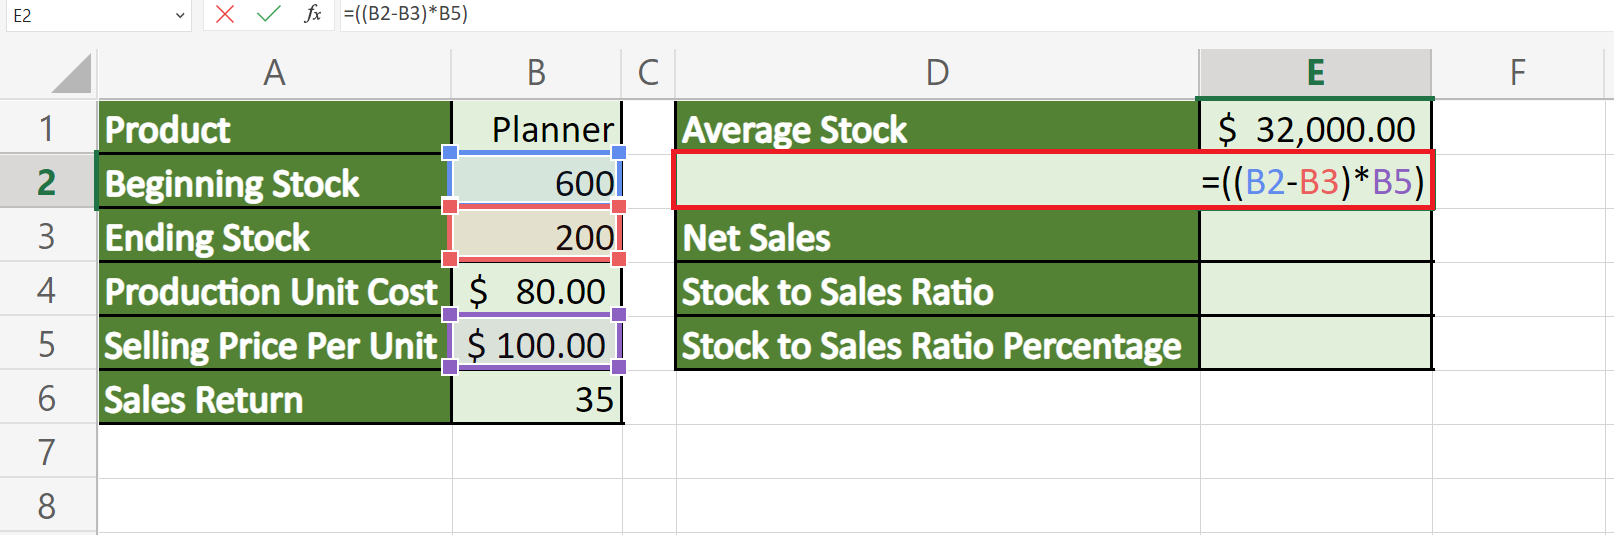
Next, we will calculate the gross sales by using the formula =(beginning inventory/ending inventory)*selling price. In our spreadsheet, the formula would be =((B2-B3)*B5)
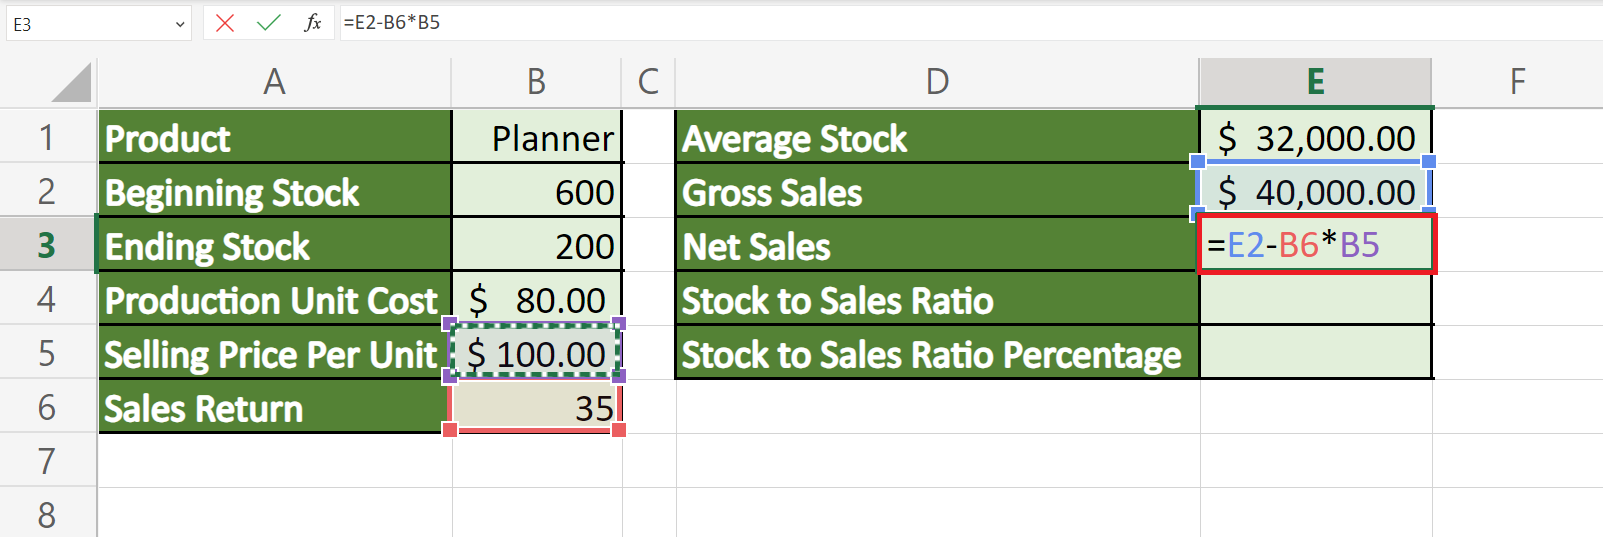
Then, we will compute the net sales using the formula =(gross sales-sales return)*selling price. In this case, our formula would be =E2-B6*B5
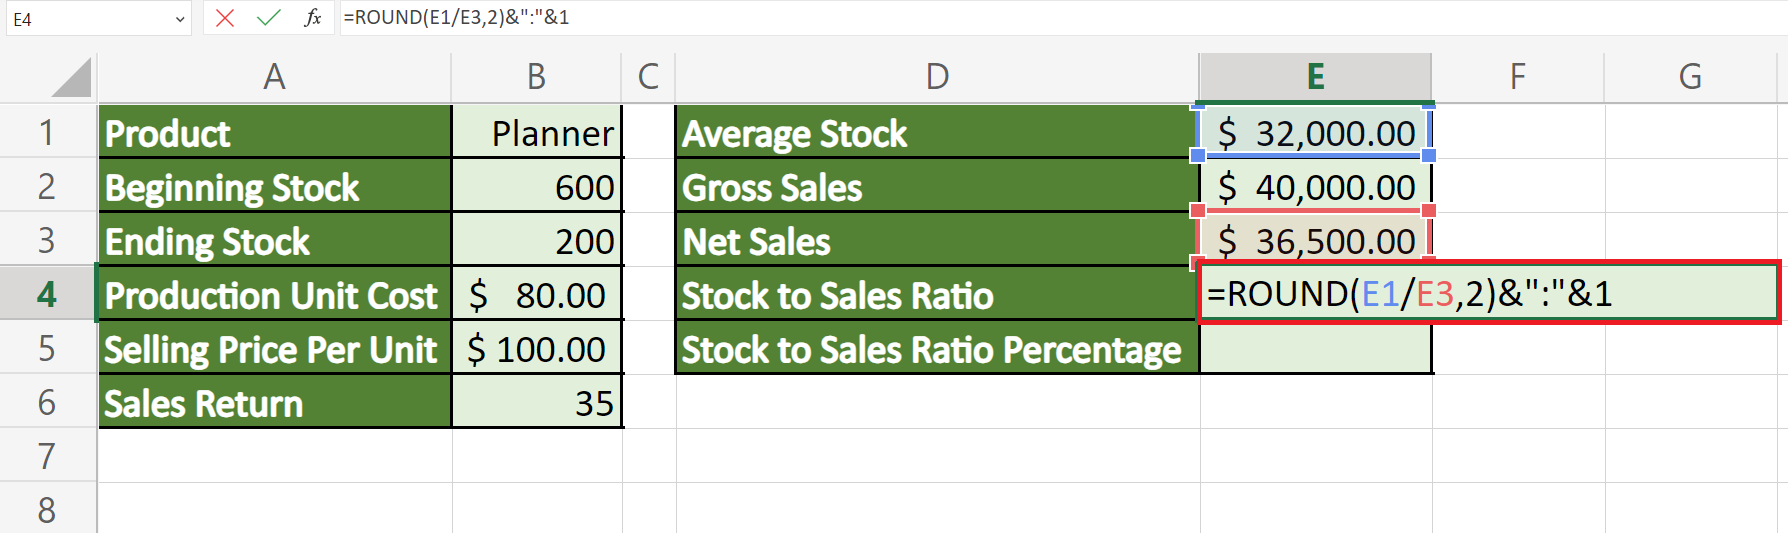
Given the three values above, we can finally calculate the stock to sales ratio with the formula = average inventory/net sale
In this example, we will input the ROUND function in our formula to round the stock to sale value to two decimal places.
Additionally, we will input a colon and the number 1 to format the result as a ratio. The ampersand symbol (&) allows us to join text items without using another function.
The final formula we will utilize would be:
=ROUND(E1/E3,2)&":"&1
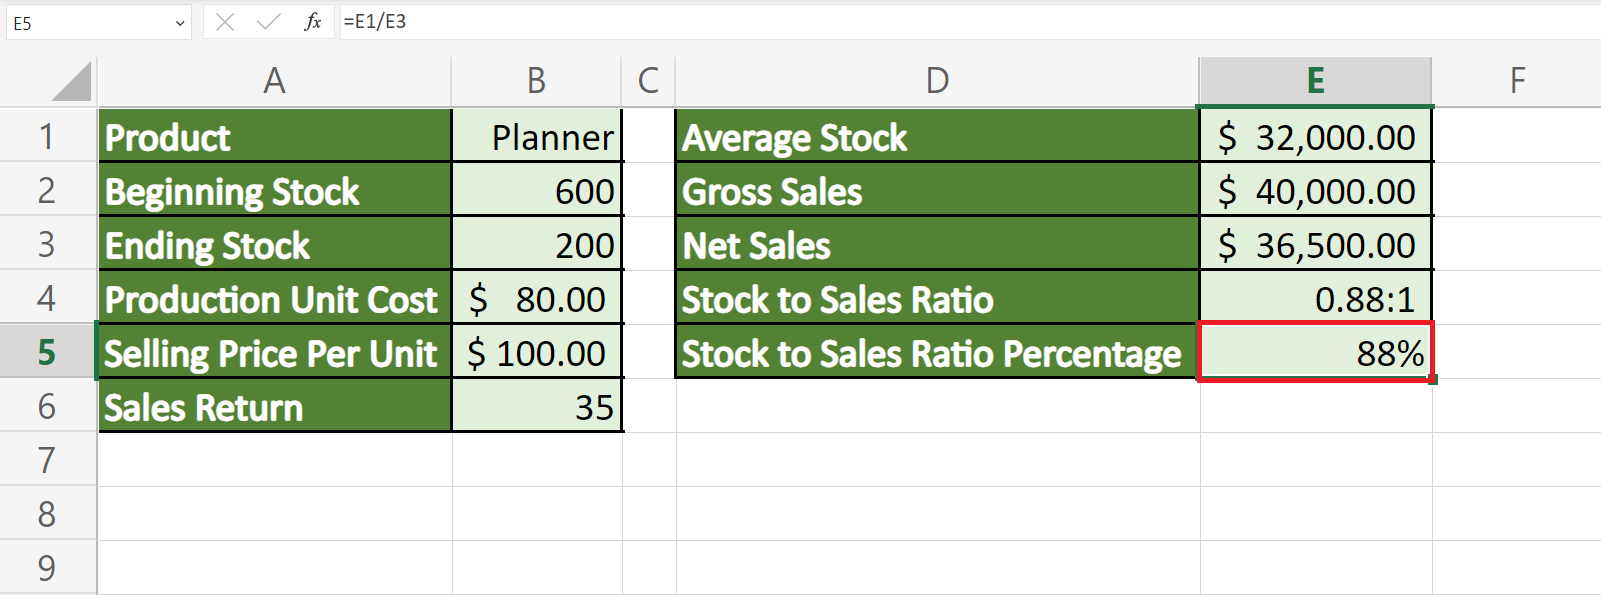
Lastly, we can convert our stock to sales ratio into a percentage by using the stock to sales formula and then adding the percentage symbol found in the Number section of the Excel ribbon.
Our final data set would look like this:
You can make your own copy of the spreadsheet above using the link below.
Amazing! Now we can dive into the steps of calculating the stock to sales ratio in Excel.
How to Calculate Stock to Sales Ratio in Excel
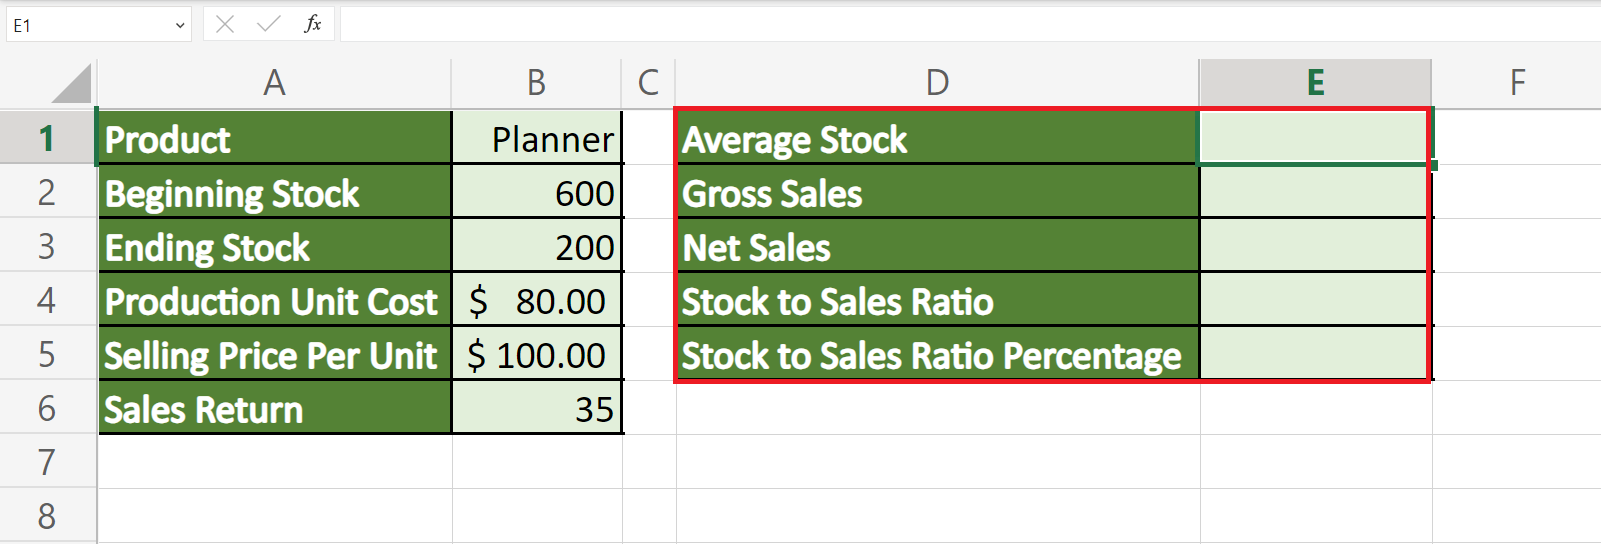
1. We will create a table containing all the necessary information about the product. The table should have the beginning stock, ending stock, production unit cost, the selling price per unit, and the sales return.
2. Moreover, we will create another table wherein we will calculate the stock to sales ratio. To do this, we will input the average stock, gross sales, and net sales which we all need to calculate the stock to sales ratio.
3. First, we will calculate the average stock value. We will input an equal sign to start our formula. Next, select the beginning inventory value and add that with the ending inventory value and then divide by 2. This will give us the formula “=(B2*B4+B3*B4)/2”.

4. We will compute the gross sales by subtracting the beginning stock and ending stock together. Then, we will multiply the value by the selling price. In this case, our formula would be “=((B2-B3)*B5)”.
5. Next, we will get the net sales. To do this, we will select the gross sales value and subtract it from the sales return. Afterward, we will multiply the result by the selling price. This will give us the formula “=E2-B6*B5”.
6. Now we can calculate the stock to sales ratio. To do this, we will first input the ROUND function which will give us the formula “=ROUND(”.

7. We will select the average stock value and divide it by the net sales value. Then, we will input the value “2” to round the value to two decimal places. Lastly, we will input a colon “:” and the number “1” to make it a ratio. We will use an ampersand symbol “&” to join the colon and number together with the result.
Our final formula will be “=ROUND(E1/E3,2)&”:”&1”.
8. Additionally, we can get the stock to sales ratio percentage. To do this, we can simply type in the formula “=E1/E3”.

9. Finally, go to the Home tab and click the percentage symbol (%) found in the Number section.

And tada! We have successfully used the gross sales formula in Excel.
You can apply this guide whenever you need to calculate the stock to sales ratio for inventory management. You can now use the ROUND function and the various other Microsoft Excel formulas available to create great worksheets that work for you.
FAQs:
1. What is a good stock to sales ratio?
In most cases, a stock to sales ratio of 1:1 is a good indication for many industries. Some industries like retail can have a ratio below 1 since their inventory turnover is faster.
That’s pretty much it! Make sure to subscribe to our newsletter to be the first to know about the latest guides and tutorials from us.