This guide will help you understand how to calculate the confidence interval of a population mean in Excel.
The confidence interval allows data analysts to understand how likely it is that a result is accurate or just a product of chance. We can determine the confidence interval to get an upper and lower estimate for the population mean.
The confidence interval refers to the probability that a population parameter will fall between two specific values. The interval is usually expected to have a 95% or 99% probability.
For example, we want to predict the test scores of a group of students. After analyzing the population, we can determine the confidence interval of the student’s test results.
After looking at the population of 100 students, we’ve determined a confidence interval of 99% between 85 and 95. If we were to take a random sample from the population 100 times, our mean should be between 85 and 95 in 99 of those samples.
Confidence intervals are useful when you want to factor in a level of uncertainty to the results of your statistical analyses.
Excel offers a few ways to derive the confidence interval for a population mean. First, we’ll show you how we can use the CONFIDENCE function and other statistical functions to compute the confidence interval manually.
We can also use the Analysis Toolpak add-in to find the confidence interval of a given population. This add-in allows the user to generate detailed descriptive statistics with a single click.
Once the user has the confidence interval, they can use that value to find the population mean’s upper and lower limits.
Now that we have an idea of how to calculate the confidence interval, let’s learn how to use it on an actual spreadsheet.
A Real Example of Calculating the Confidence Interval for a Population Mean
The following section provides several examples of how to calculate the confidence interval in Microsoft Excel. We will also go into detail about the formulas and tools used in these examples.
First, let’s take a look at the manual method of calculating the confidence interval.
Suppose you have a population of students who took the same test. We want to calculate the upper and lower bound of the population mean with a confidence interval of 95%.
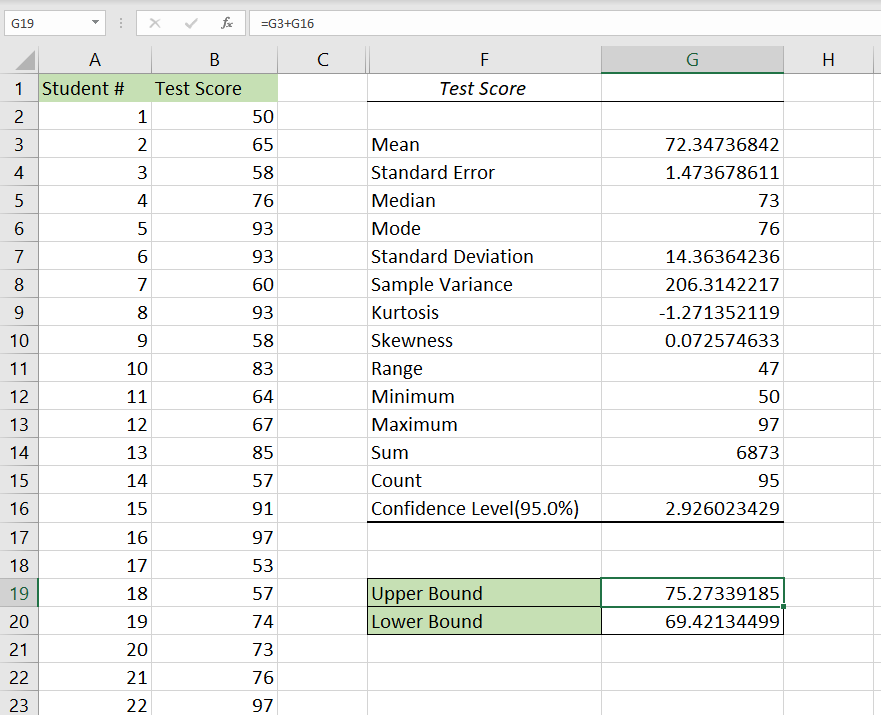
In the example below, we’ve set up a table that will help us calculate the values we need to retrieve the confidence interval of our population.
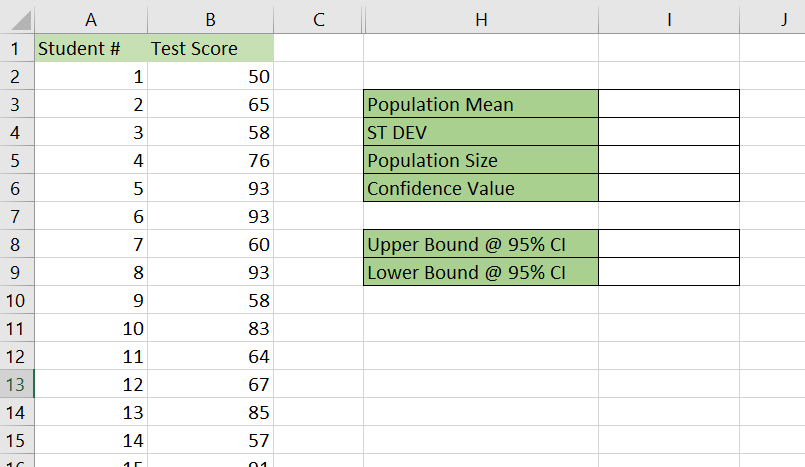
After filling out the table with the proper formulas, the table should now look like this:
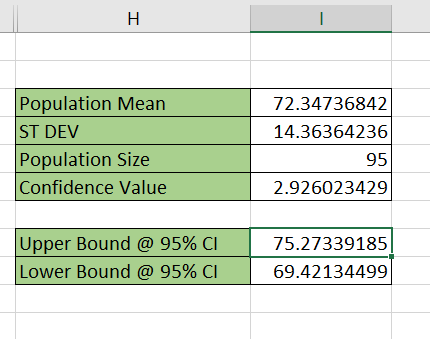
To get the population mean, we just need to use the following formula:
=AVERAGE(B2:B96)
We can use the following formula to get the standard deviation:
=STDEV.S(B2:B96)
We can obtain the confidence value using the CONFIDENCE function:
=CONFIDENCE.T(1-0.95,I4,I5)
To get the upper bound and lower bound, we’ll have to add and subtract the confidence value from the derived population mean. The higher number will be our upper bound, and the lower number, our lower bound for the confidence interval.
We can also generate the confidence value automatically through the Analysis Toolpak add-in.

Do you want to take a closer look at our examples? You can make your own copy of the spreadsheet above using the link attached below.
If you’re ready to try calculating the population mean’s confidence interval, start reading our step-by-step tutorial below on how to do it!
How to Calculate Confidence Interval for Population Mean in Excel
This section will guide you through each step needed to derive the confidence interval of a population mean. We’ll go over two different methods we can use to compute the confidence value: manual calculation and the Analysis Toolpak.
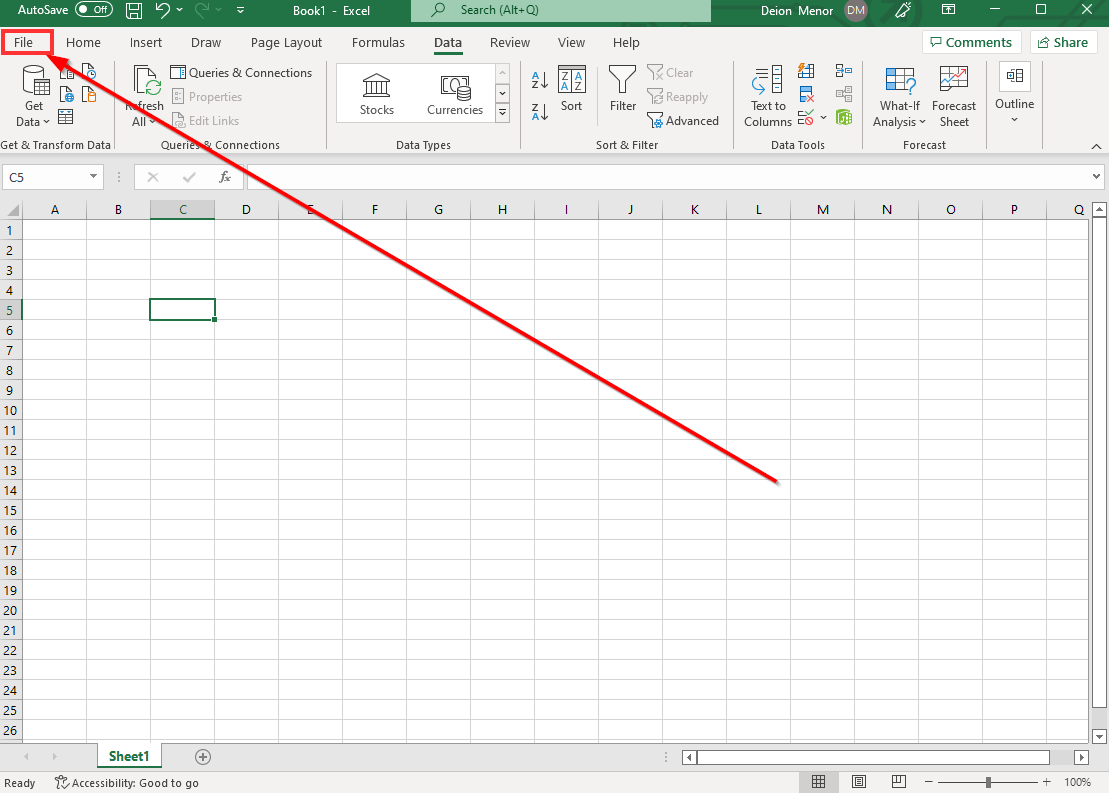
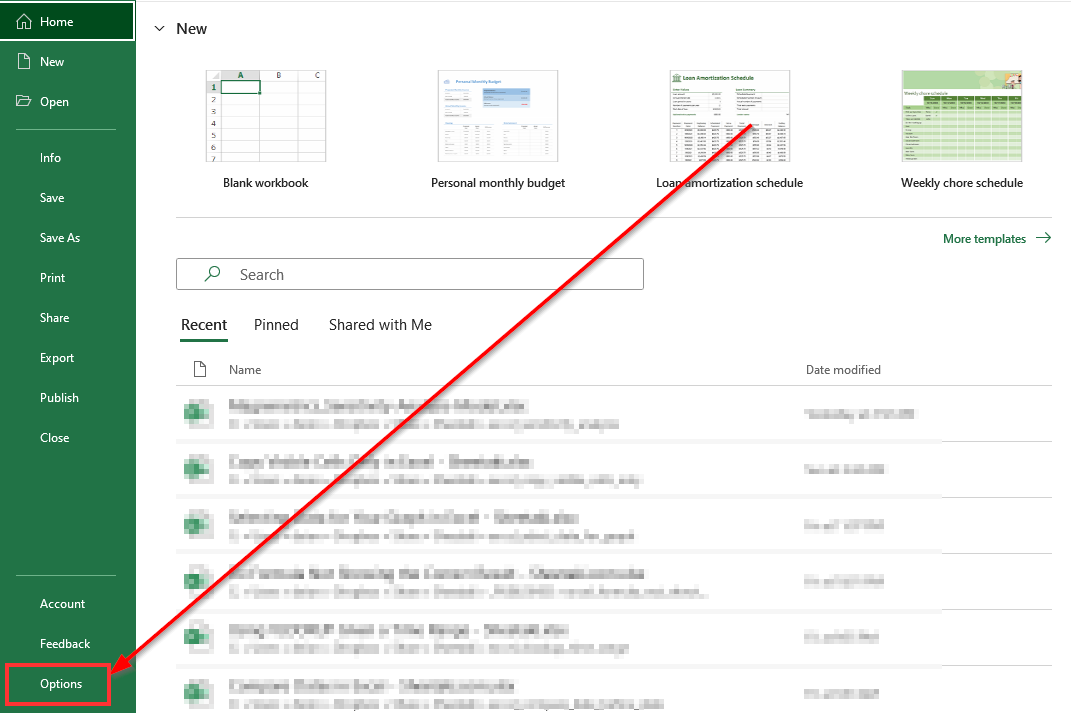
- First, let’s try using the Analysis Toolpak add-in to get our confidence value. In your current spreadsheet, navigate to the File tab.
- In the File tab, click on the Options button on the lower-left corner.
- In the Excel Options dialog box, go to the Add-Ins tab. In the dropdown menu next to the label ‘Manage’, select the Excel Add-ins option and click Go.
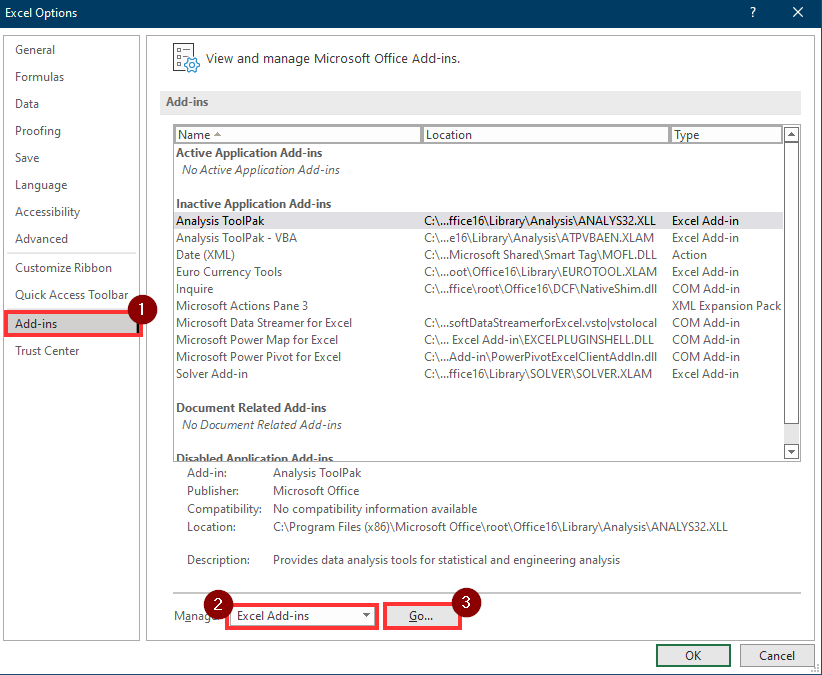
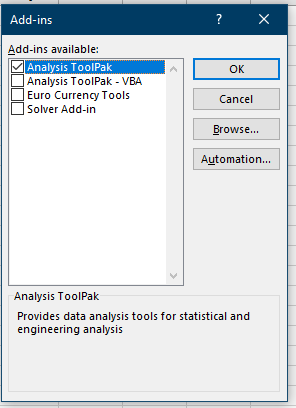
- In the Add-ins dialog box, ensure that the Analysis Toolpak option is checked. Click on the OK button to apply the add-on to your current workbook.
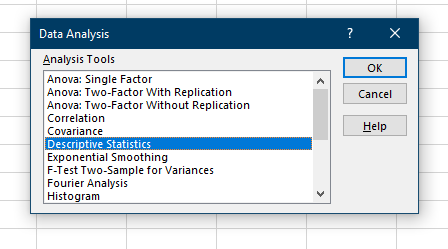
- In the Data tab, click on the newly-added Data Analysis option.

- The dialog pop-up will show you a list of available data analysis tools. Select the Descriptive Statistics tool and click on OK.
- For the input range, select the range that contains the population data. Adjust the options to indicate that the data is grouped by columns and has labels in the first row. For the output options, choose an empty cell in your sheet as the start of its output range. Check the option to show summary statistics and to compute with your chosen confidence level.

- After clicking on OK, the tool should paste the output into your sheet. In this example, we want to use the confidence level value for our test score. This can be found in cell G16.
- To get the upper bound and lower bound of our confidence interval, we just need to add and subtract the confidence level from the computed mean.
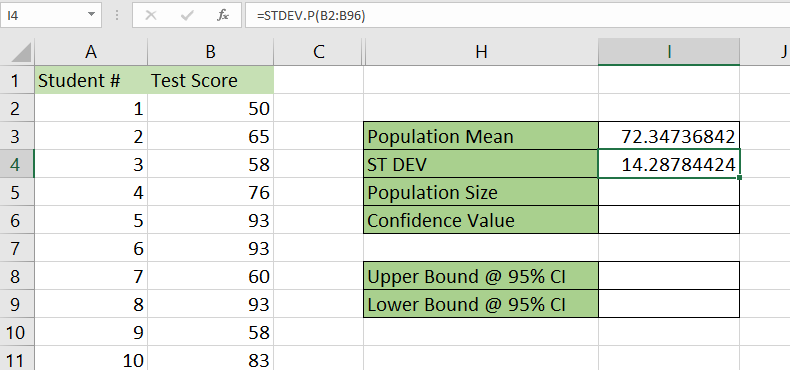
- Next, we’ll try to obtain our confidence interval manually. Create a table similar to the one seen below.
- Compute for the population mean using the
AVERAGEfunction.

- Next, use the
STDEV.Pfunction to calculate the standard deviation.
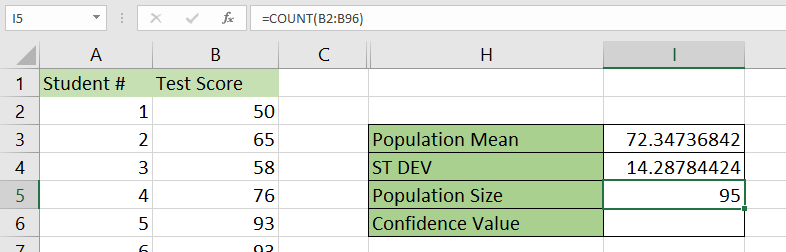
- We’ll use the
COUNTfunction to return the population size.
- We’ll use the
CONFIDENCE.Tfunction to return the confidence value we need to get our confidence interval.
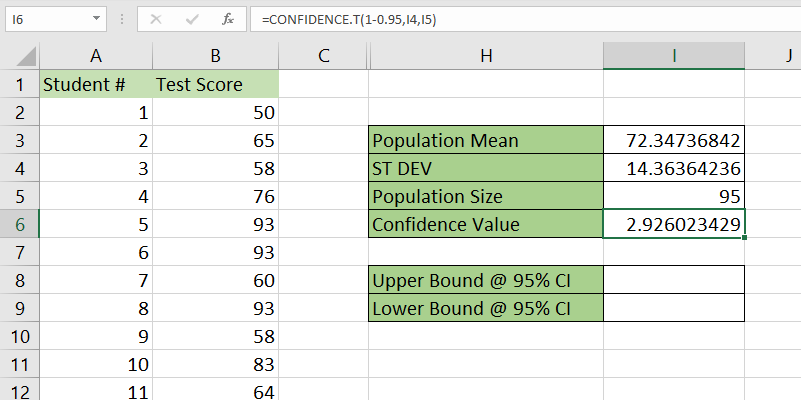
- After retrieving the confidence value, we can now determine the upper and lower bounds of the confidence interval for the population mean. In this example, we’ve also determined with 95% certainty that the mean test score falls between 69.42 and 75.27.
This step-by-step guide is a quick introduction to computing the confidence interval in Microsoft Excel. Overall, this step-by-step breakdown will be helpful if you need to find the confidence interval for a population mean.
We’ve also shown how to compute the confidence interval manually and with the Analysis Toolpak add-in.
This is just one example of the many Excel functions you can use in your spreadsheets. Our website offers hundreds of other functions and methods to help you get more out of Microsoft Excel.
With so many other Excel functions available, you can find one appropriate for your use case.
Subscribe to our newsletter and you’ll get exclusive access to the latest spreadsheet guides and tutorials from us.