This guide will explain to you how to use Google Data Studio in Google Sheets.
Google Data Studio is a tool that helps its users convert data into reports and dashboards. So that its users can easily organize and present data in a way that makes it easy to identify trends, analyze data, and pull insights from it.
Although users can also organize and analyze data in Google Sheets, it is not sufficient. And someone who often analyzes data will need something that provides further analysis and visual presentation. For that reason, knowing how to use Google Data Studio in Google Sheets is an important skill.
Creating a Google Sheet spreadsheet containing all needed data will simplify the process. Also, most data you need may already have a spreadsheet. So that users can easily transfer data from Google Sheets to Google Data Studio. It is not difficult to process to learn how to do this.
Now, let’s look at a scenario where you need to use Google Data Studio in Google Sheets.
Supposed you need to present a sales report on the products your company is selling. Moreover, you need to present it in a clear, concise, and visually appealing way, you opted to use Google Data Studio.
Besides, the data you need was already inputted into a spreadsheet. So you simply used that as a data source for your Google Data Studio report.
Now, enough about that. Let’s start by seeing a real example of what it would look like to use Google Data Studio in Google Sheets.
A Real Example of Using Google Data Studio in Google Sheets
First, take a look at the example below. Let’s begin by seeing the spreadsheet we will be using as a data source for Google Data Studio. It shows data about the quantity of apples, bananas, and grapes sold for the year’s first half.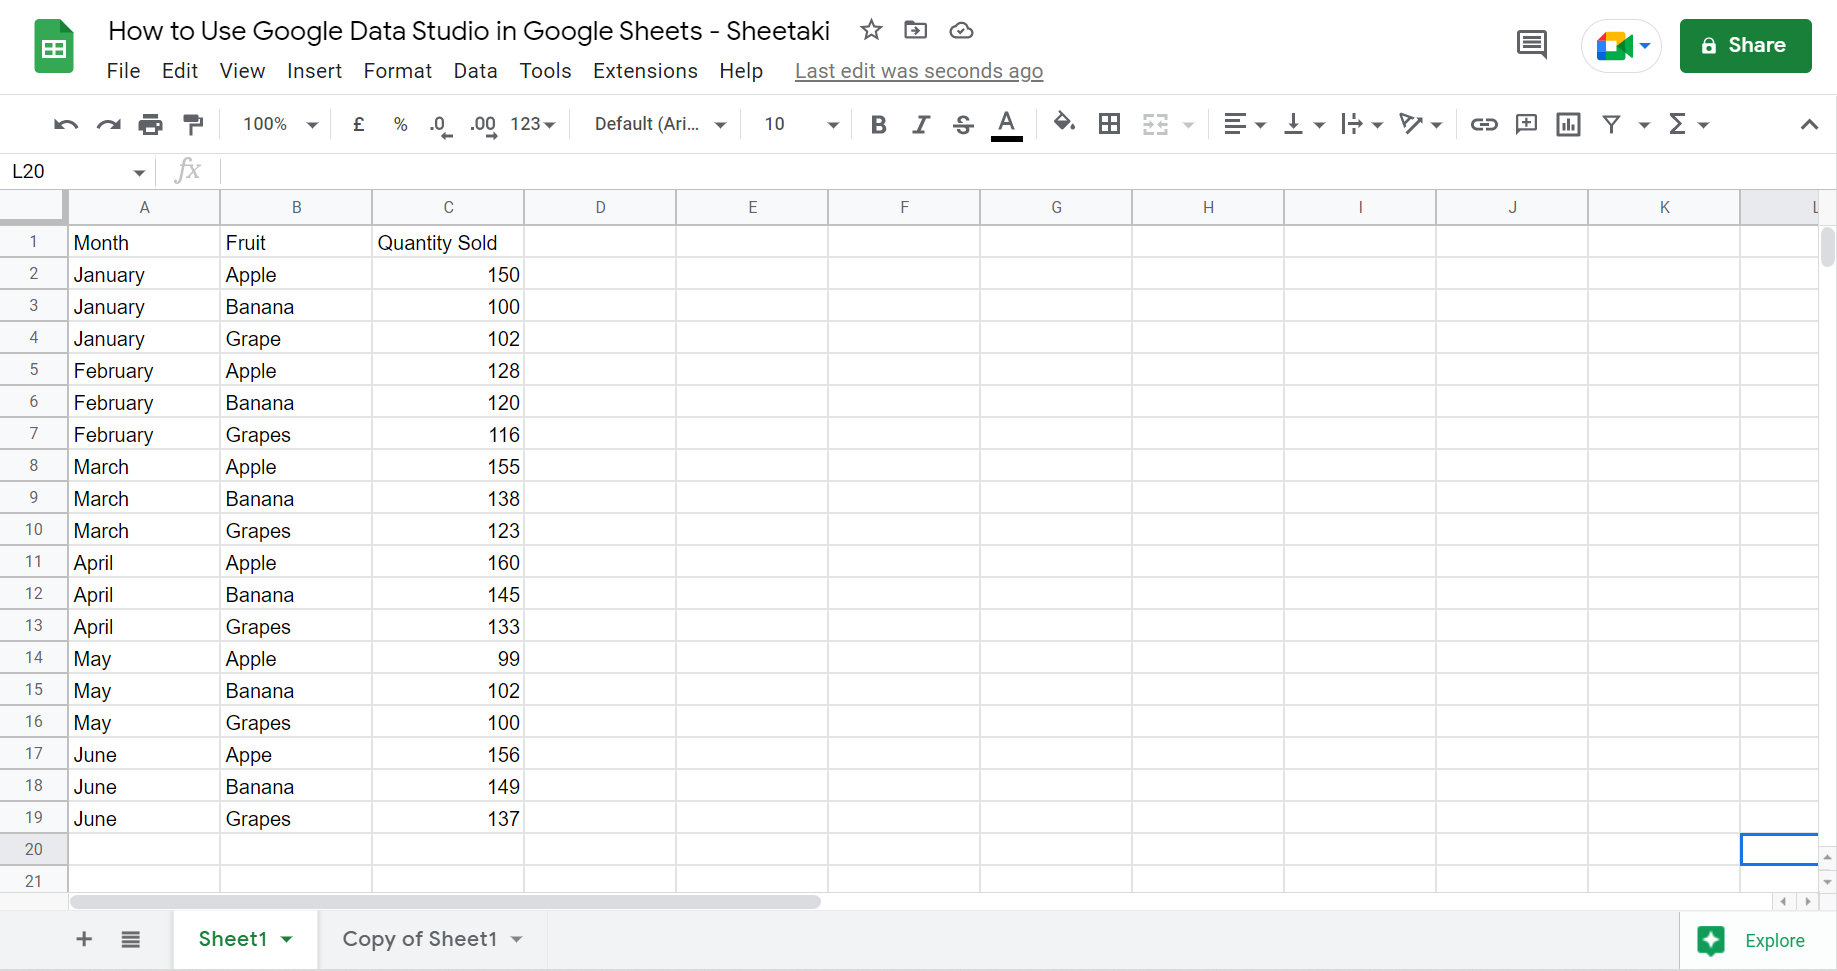
A simple tabular format for your spreadsheet will make it easier to use that data in Google Data Studio. Also, avoid using merged cells as it can make your data appear incorrectly. And you can’t have images or graphs in your spreadsheet as they cannot be imported.
Note: Make sure to have column headers since these will become the field names.
Additionally, the data structure should be longer rather than wider. So use categories for grouping the data to limit the number of dimensions. For instance, the one above is a long table example which is better than doing a wide table similar to the one below.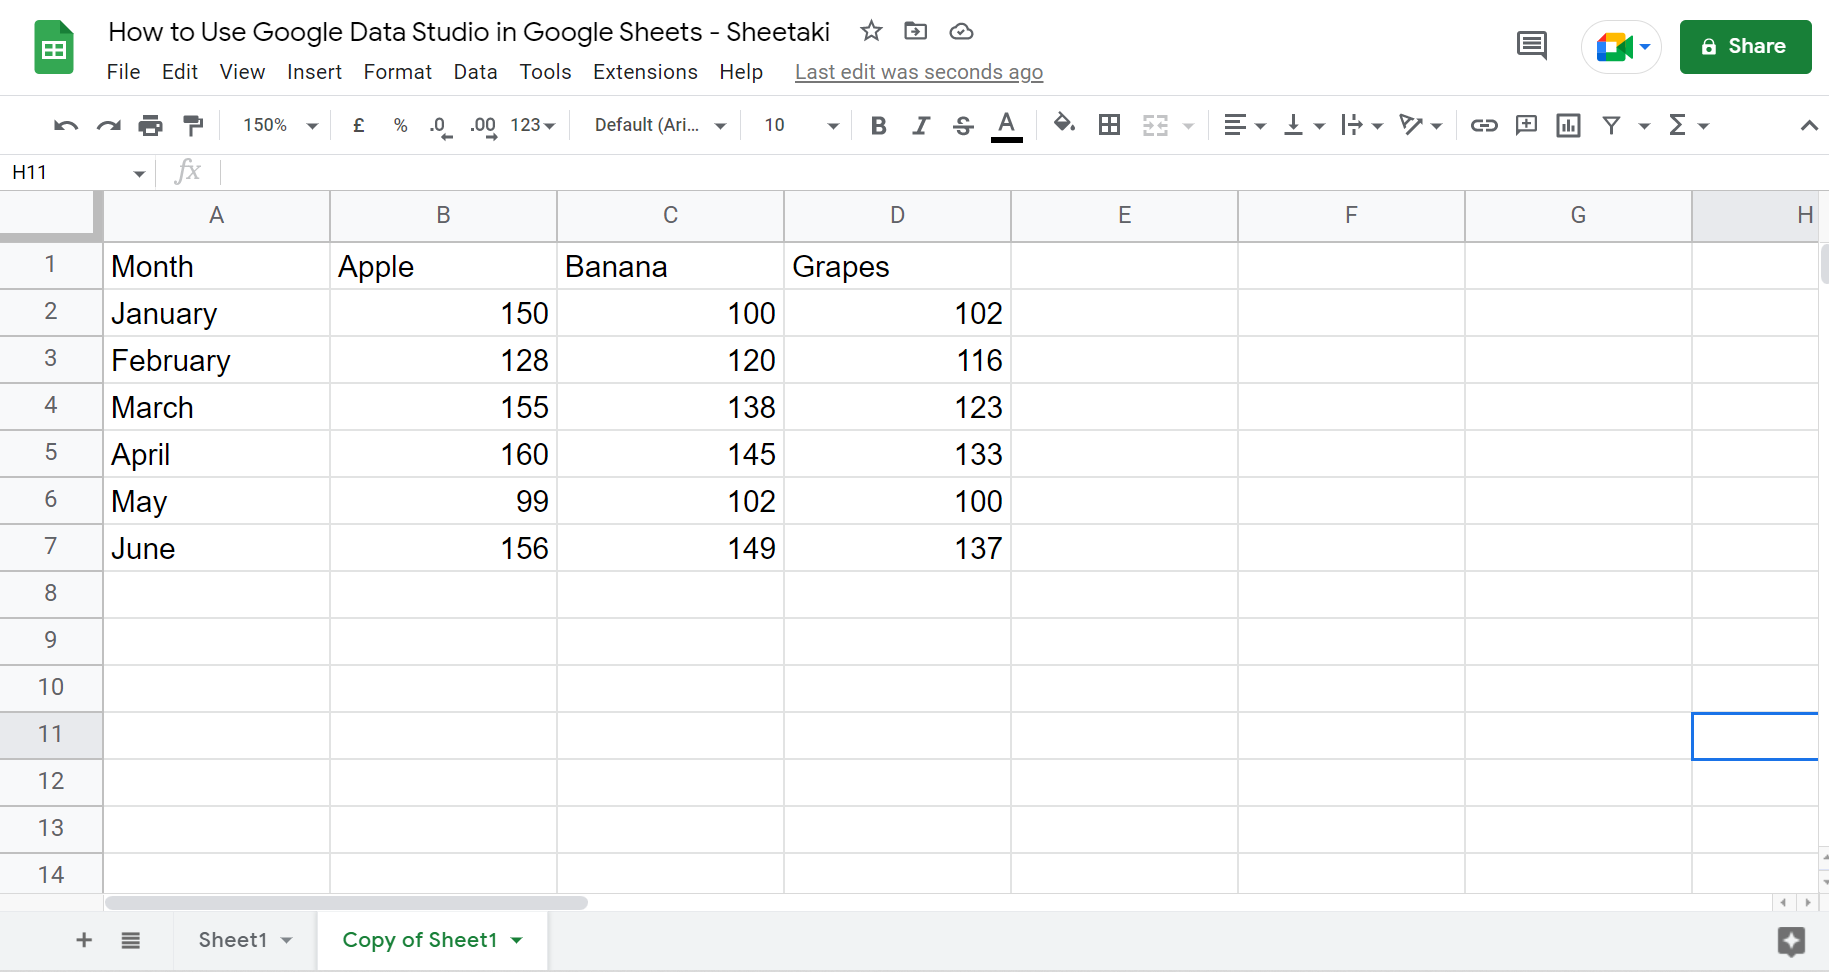
On the wide table, it will require one dimension for each fruit. So you will most likely have more than 10 types of fruit in real life. For other data, you will have 100 needed dimensions. So a long table is better than a wide one. And it will make it easier for you to create your report in Google Data Studio.
Also, it is more efficient to not include the totals row in the data source. There is a chance it might not show up correctly in charts. So it’s best to let Google Data Studio do the calculations.
Now, let’s see what the data would look like after using Google Data Studio.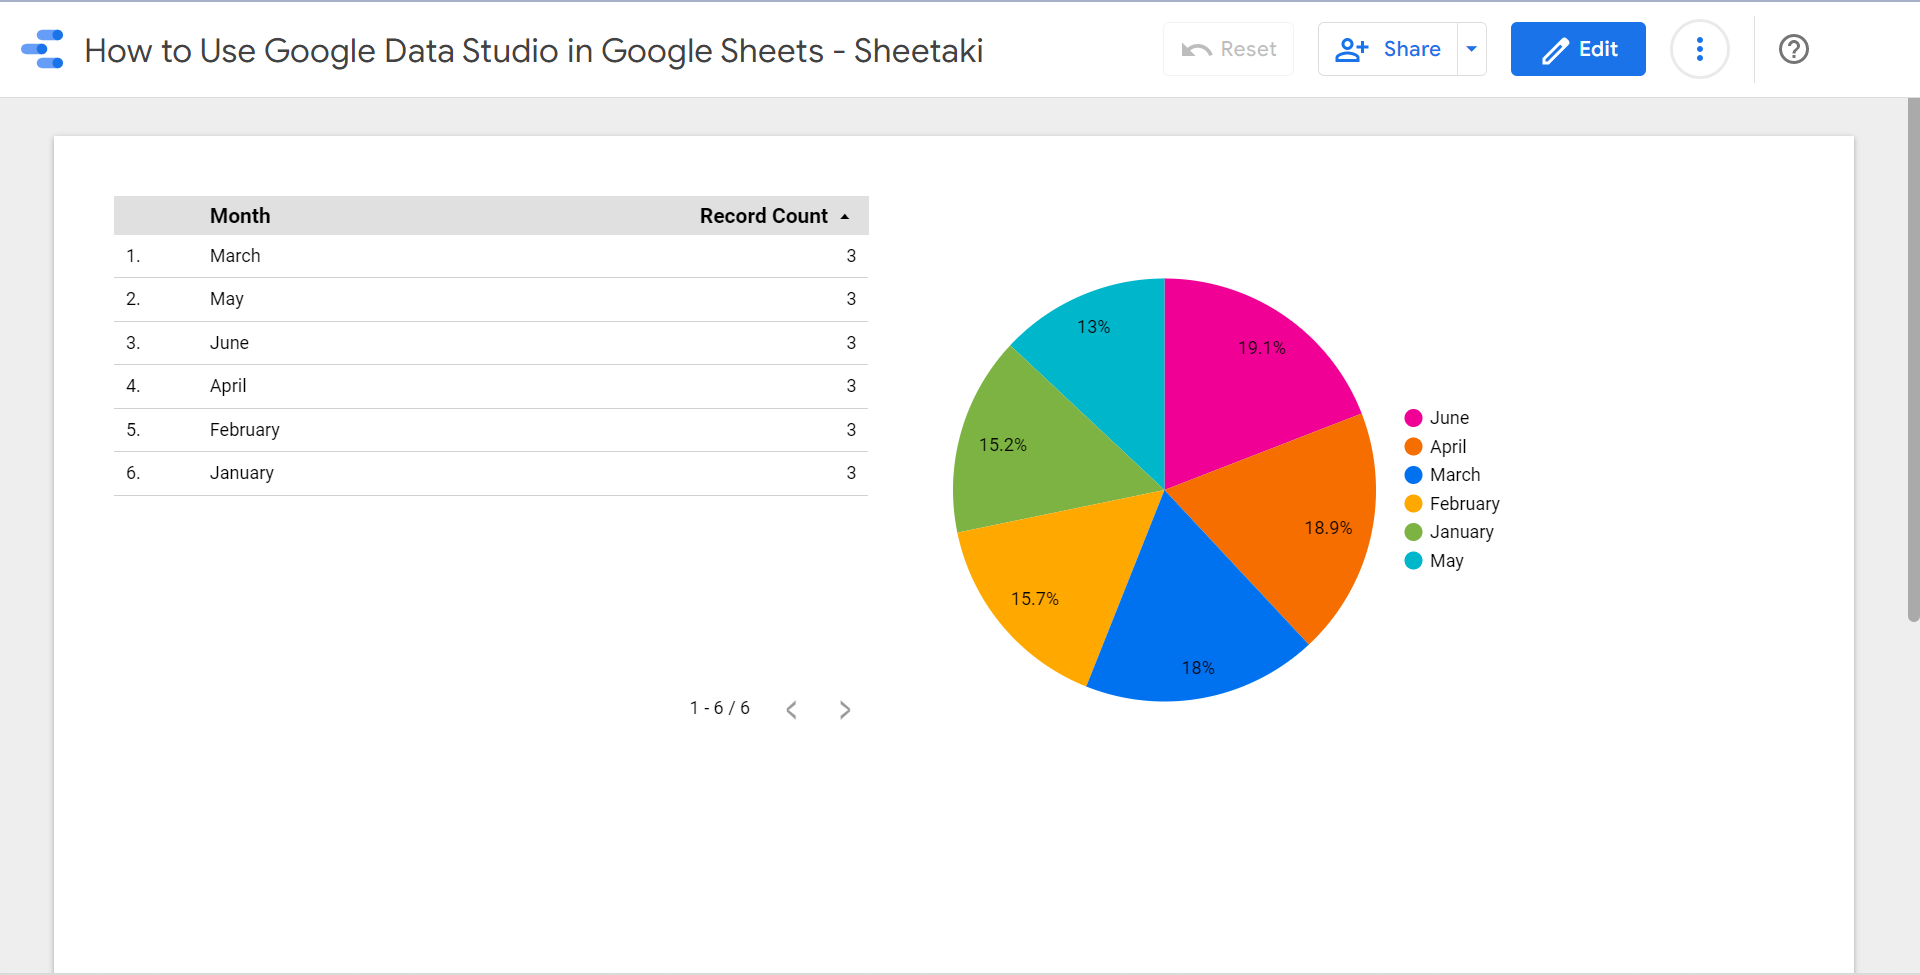
So this is what your data would look like after using Google Data Studio. It presents your data in a manner that is visually pleasing and also efficient for analysis.
You can make your own copy of the spreadsheet above using the link attached below.
Great! Let’s not waste any more time and learn the step-by-step process for you to start using Google Data Studio in Google Sheets.
Steps in Using Google Data Studio in Google Sheets
This section will contain detailed instructions to guide you through the process. Furthermore, each step will have pictures to make it easier to follow along.
1. First, go to Google Data Studio on your computer. Click Use It for Free button. After clicking, you will be led to the home page of Google Data Studio.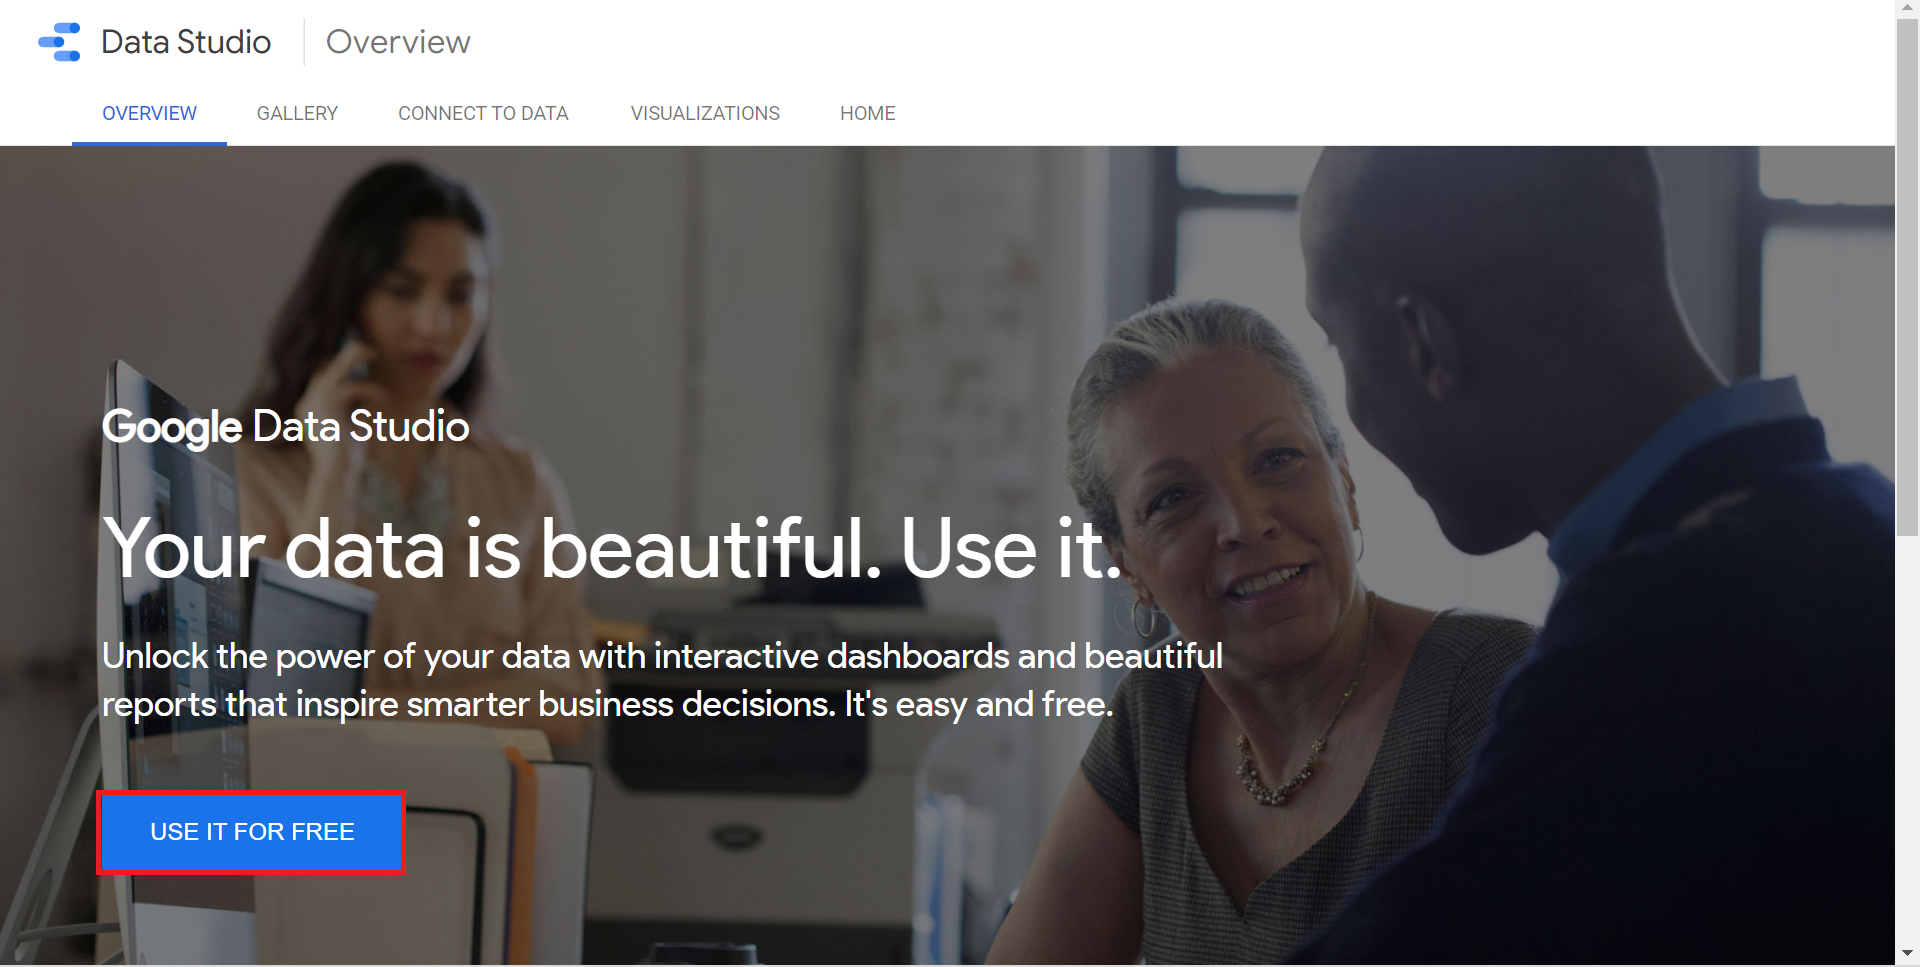
2. Second, click Create at the upper left of the homepage.
3. Then, a dropdown menu will appear. So click on ‘Data source‘.
4. After, a list of Google Connectors to different data sources will appear. So find and click Google Sheets. Also, you can search for it at the search bar provided at the top.
5. Look for the spreadsheet you want to use. And click on the specific file under Spreadsheet. Then, click on the specific sheet under Worksheet.
6. Additionally, there are optional settings you can check or uncheck. Check Use first row as headers if you already have column headers made. If you don’t, Google Data Studio will use the default column labels in the Sheets.
Also, check to Include hidden and filtered cells if you have them and would want to include them. If not, uncheck this box.
7. Finally, click CONNECT, found at the top right corner. 
8. After, you will see a window that contains all the DIMENSIONS, the green ones, and the METRICS, the blue one. Here, you can configure your data to ensure accuracy.
9. Sometimes, Google Data Studio won’t have the correct data type for each field. So you need to double-check if it matches. You can click on the dropdown arrow to change the field type if necessary.
10. Also, you can change the field’s name if necessary by simply clicking on it. But, it is recommended to change the names in Google Sheets instead. 
11. After you check everything and it’s all good to go, click on CREATE REPORT found in the upper right corner. 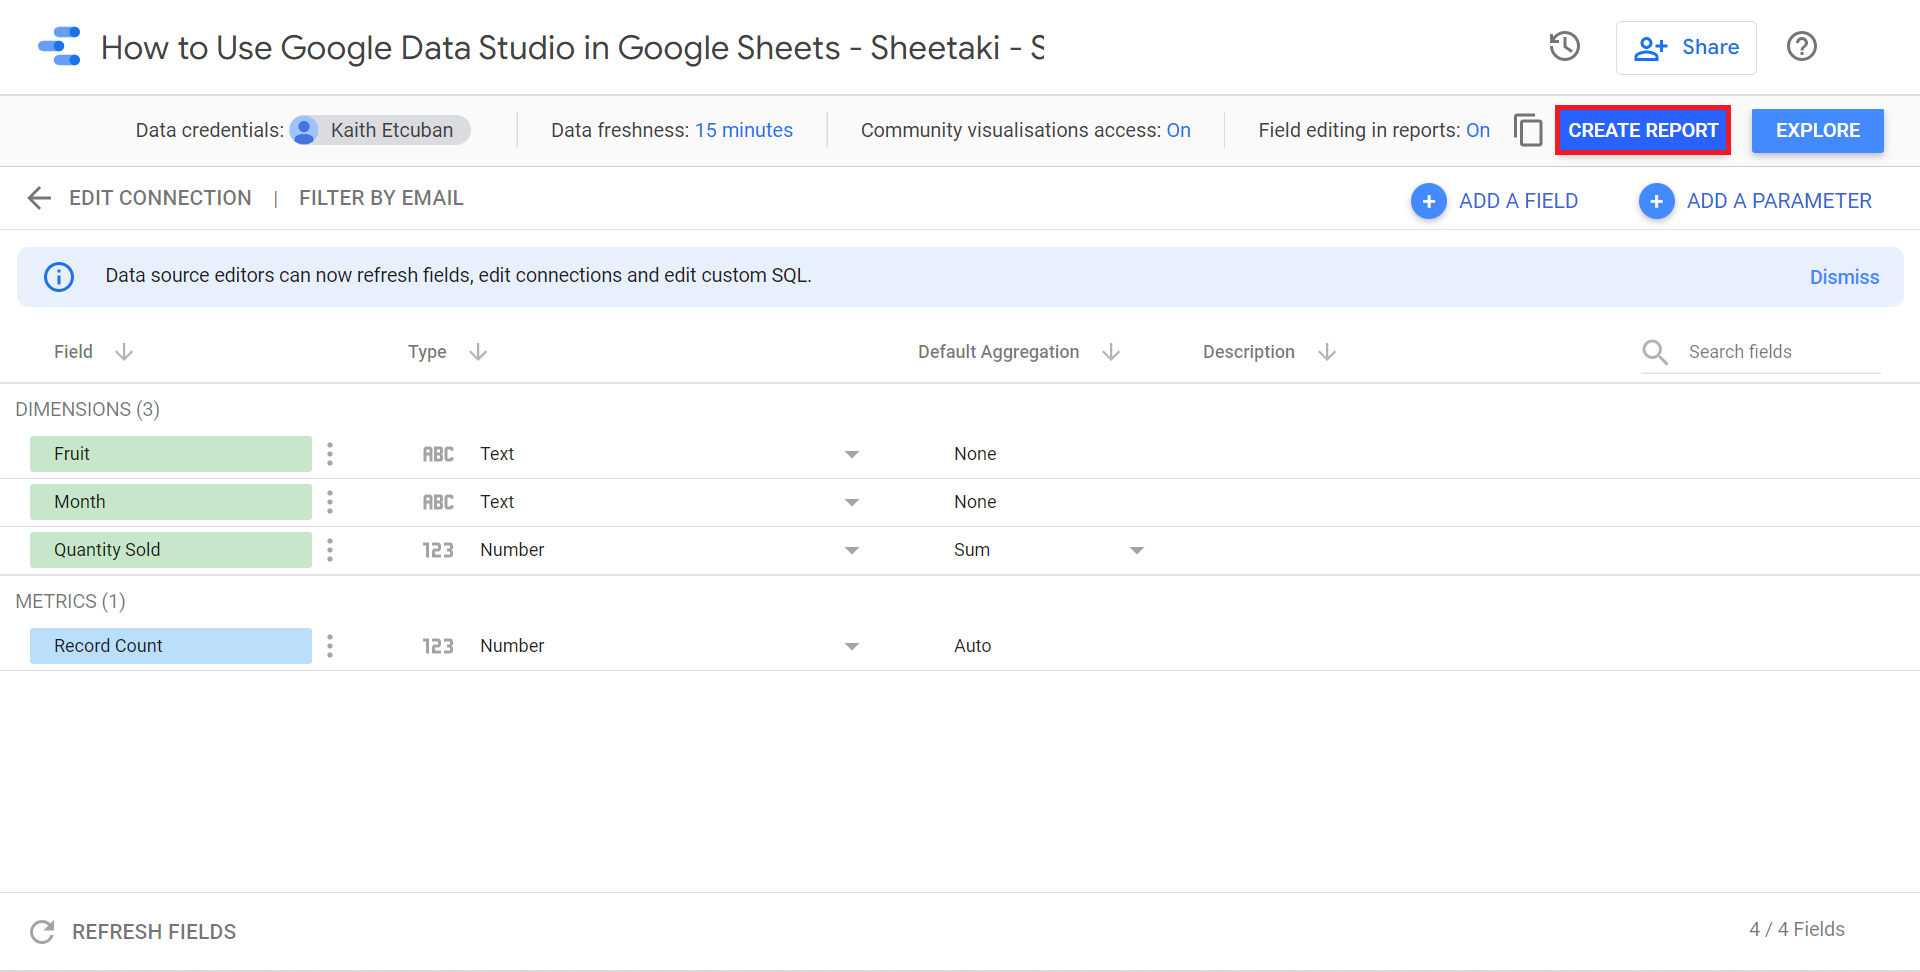
12. After, you will see a dialog box appear. Then, click on ADD TO REPORT.
13. You will be led to a similar screen to the one below. Then, you can rename your report by double-clicking on ‘Untitled Report‘ in the upper left corner. 
14. At the top, you can see a toolbar with several components you can add to your report. So you can add pages, data, charts, shapes, images, text, and even a URL. Take your time exploring this toolbar to decide what to add to improve your report.
15. For example, you want to add a chart. Click on Add a chart at the toolbar. Then, in the dropdown menu, choose what chart works best for your report. Also, you can click anywhere on the page to add the chart. 
16. After the chart is added, a menu will appear on the right side of the screen. Then on DATA, you can see the list of available fields.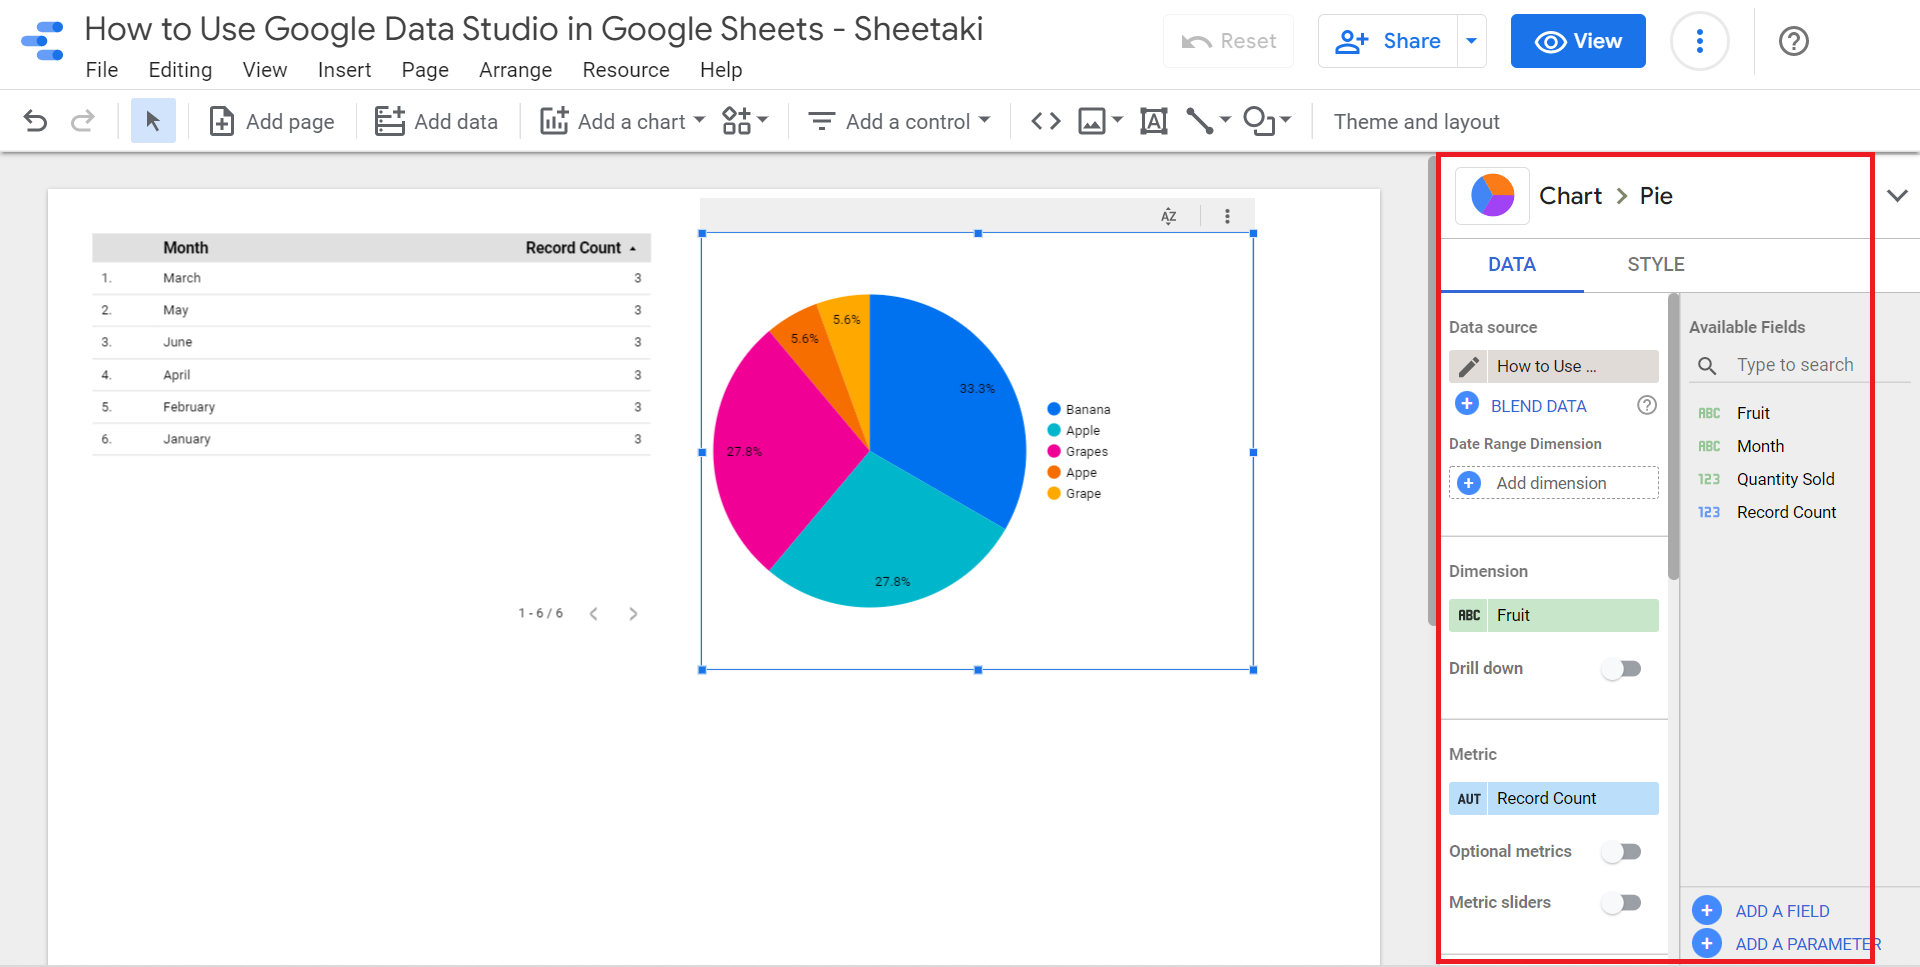
Additionally, you can change the Dimension by simply dragging the field you want from the right side over to the Dimension. Also, you can change the Metric by doing the same way.
17. For instance, I changed the Dimension from Fruit to Month instead. And I changed the Metric from Record Count to Quantity Sold. All the changes made here will automatically apply to the chart. Furthermore, you can also change the style of the chart by clicking on STYLE. 
18. After making all the necessary changes, you can check how your report looks in view mode. Finally, click on View on the upper right side. 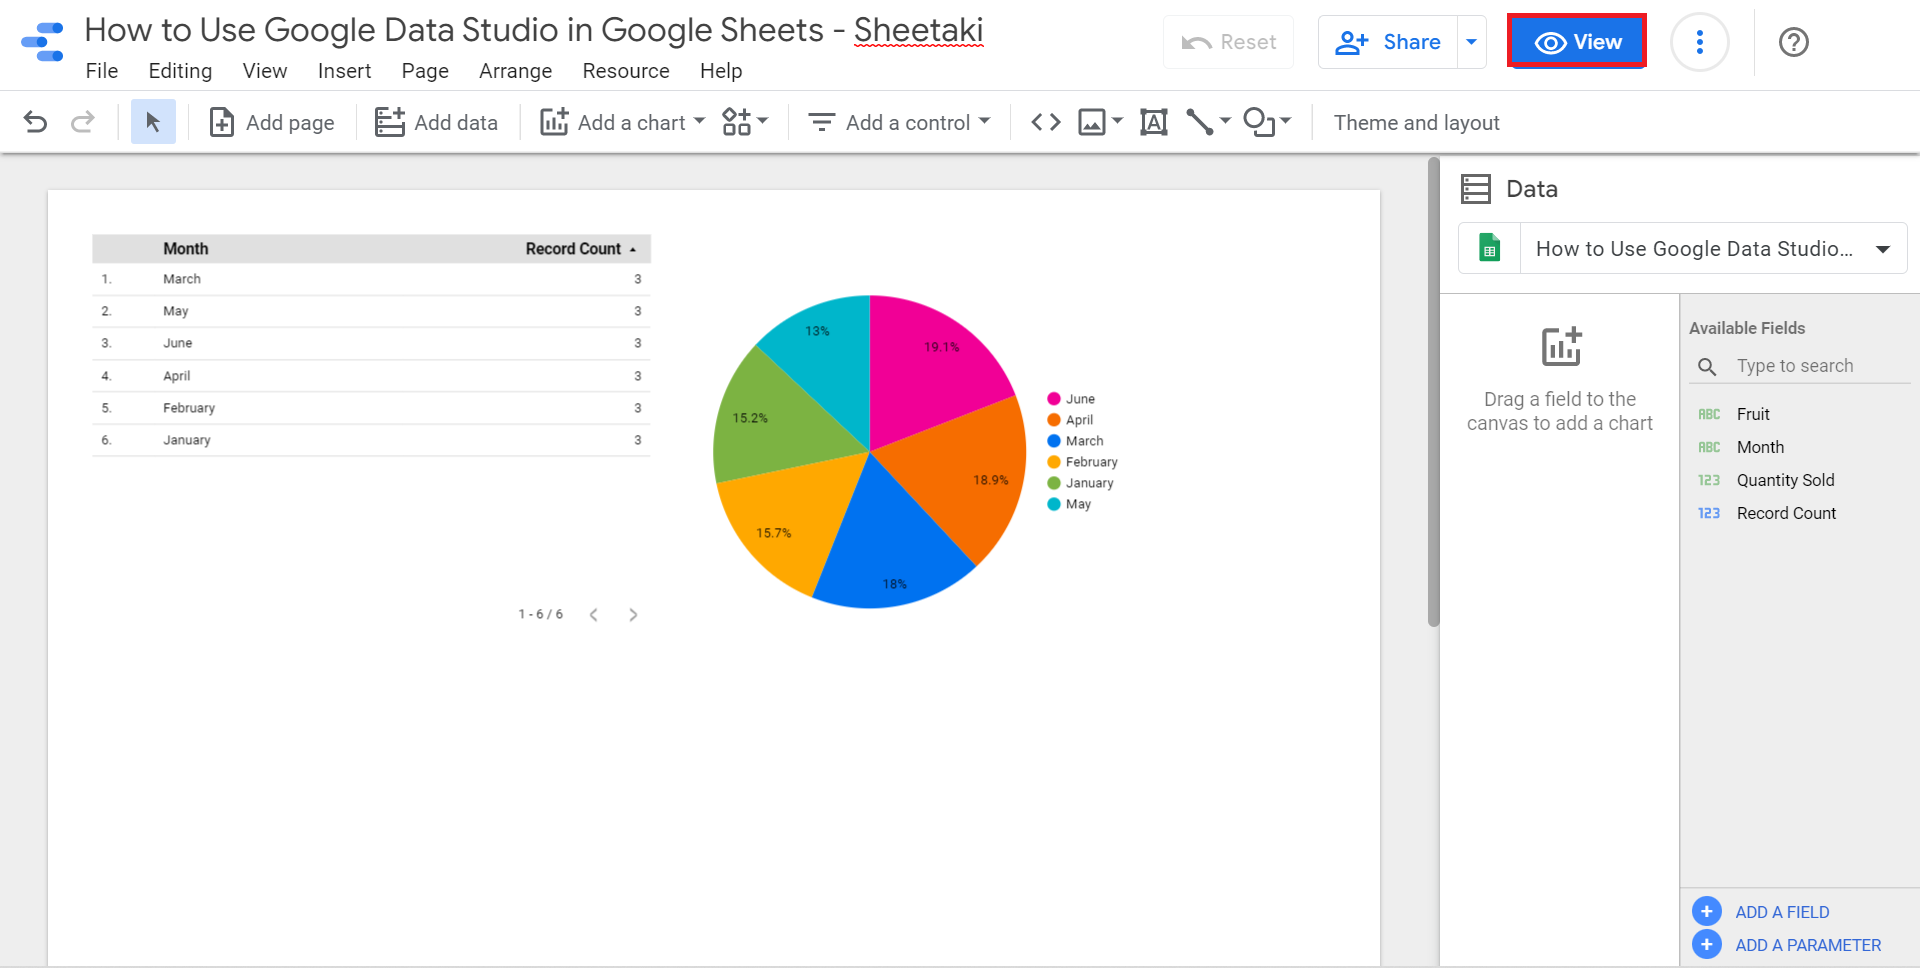
19. And tada! This is how you can use Google Data Studio in Google Sheets.
20. Lastly, if you need to make changes, click Edit on the upper right. Then, it will lead you back to the previous screen to make some edits.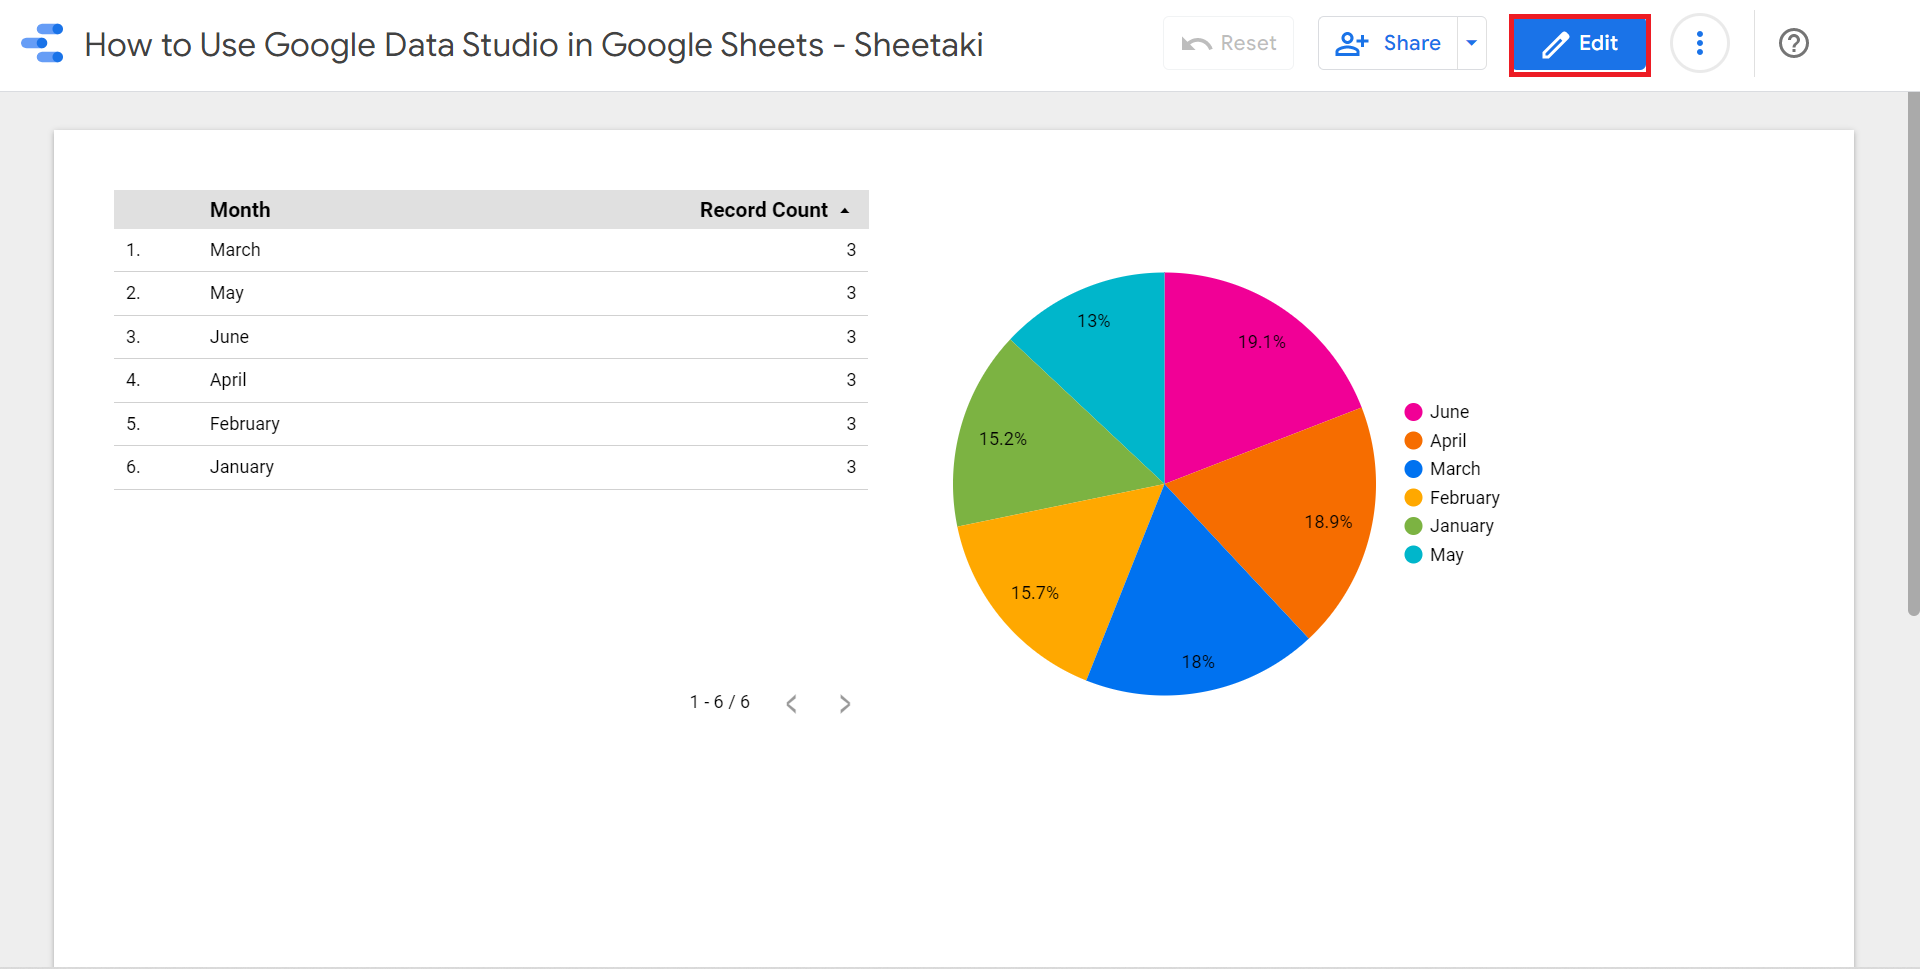
That’s it! You have learned how to use Google Data Studio in Google Sheets. So from now on, you can perform better data analysis and data presentations. But, it may have taken a lot more steps than you thought. Clearly, with this guide, you will do this with ease.
Are you interested in learning more about what Google Sheets can do? Make sure to subscribe to our newsletter to be the first to know about the latest guides and tutorials from us.