This guide will teach you how to use aggregation in Google Sheets.
In other words, you can aggregate or summarize your dataset by calculating the average, count, sum, maximum, and minimum in Google Sheets to improve data analysis.
Aggregation is often used to create a useful summary of a large amount of data for analysis. So it calculates multiple values and returns them as a single value.
Google Sheets does not have a single function for aggregation. Hence, this guide will discuss how to perform aggregation using the available aggregate functions in Google Sheets.
Let’s take an example wherein you must aggregate your data for better analysis.
Supposed you are making a report on your sales. Since it will most likely contain large amounts of data, you want to see the summary of the dataset at a glance. For this reason, aggregating the data will make it possible.
Not only will it save you time from checking every single value, but it also will organize your data for easier access and analysis. Now that’s just one out of the many examples for aggregating your data in Google Sheets.
Whatever reason you have for doing it, learning how to use aggregation in Google Sheets will always be useful. Great! Let’s begin by learning about the anatomy of the aggregate functions that are available in Google Sheets.
The Anatomy of the SUM Function
So the syntax (the way we write) the SUM function is as follows:
=SUM(value1, [value2, …])
Let’s dive into this thing and understand what each of these terms means:
- = the equal sign is how we start any function in Google Sheets.
- SUM() this is the
SUMfunction.SUMis used to add all the values from a specified range of cells together.
- value1 is the first value or number you want to add.
- value2 and so on are the rest of the values or numbers you want to add together.
- Simply put, (value1, [value 2, …]) refers to the values or numbers you want to add together.
- Entering a text into the SUM function will result in a #NAME? error.
The Anatomy of the COUNT Function
So the syntax (the way we write) the COUNT function is as follows:
=COUNT(value1, [value2, …])
Let’s dissect this formula and understand what each of these terms means:
- = the equal sign is just how we start any function in Google Sheets.
- COUNT() this is the
COUNTfunction.COUNTis used to calculate the total number of values in a dataset.
- value1 is the first value or number you want to include in counting.
- value2 and so on are the rest of the values or numbers you want to include in counting.
- Simply put, (value1, [value 2, …]) refers to the values or numbers you want to consider for calculating the total number of values in a dataset.
So we have dissected the anatomy of two functions: the SUM function and COUNT function. Additionally, there are still more aggregate functions you can use in Google Sheets which are the AVERAGE function, MAX function, and MIN function.
The AVERAGE function is used to calculate the average value of a dataset. At the same time, the MAX function and MIN function are used to calculate a dataset’s maximum value and minimum value, respectively.
A Real Example of Using Aggregation in Google Sheets
Take a look at a real example below. First, consider the following dataset. So this is what your spreadsheet would look like before using aggregation.
Now, let’s say you want to use aggregation to summarize the data you will use for analysis. After using the aggregate functions, the final spreadsheet would look like this: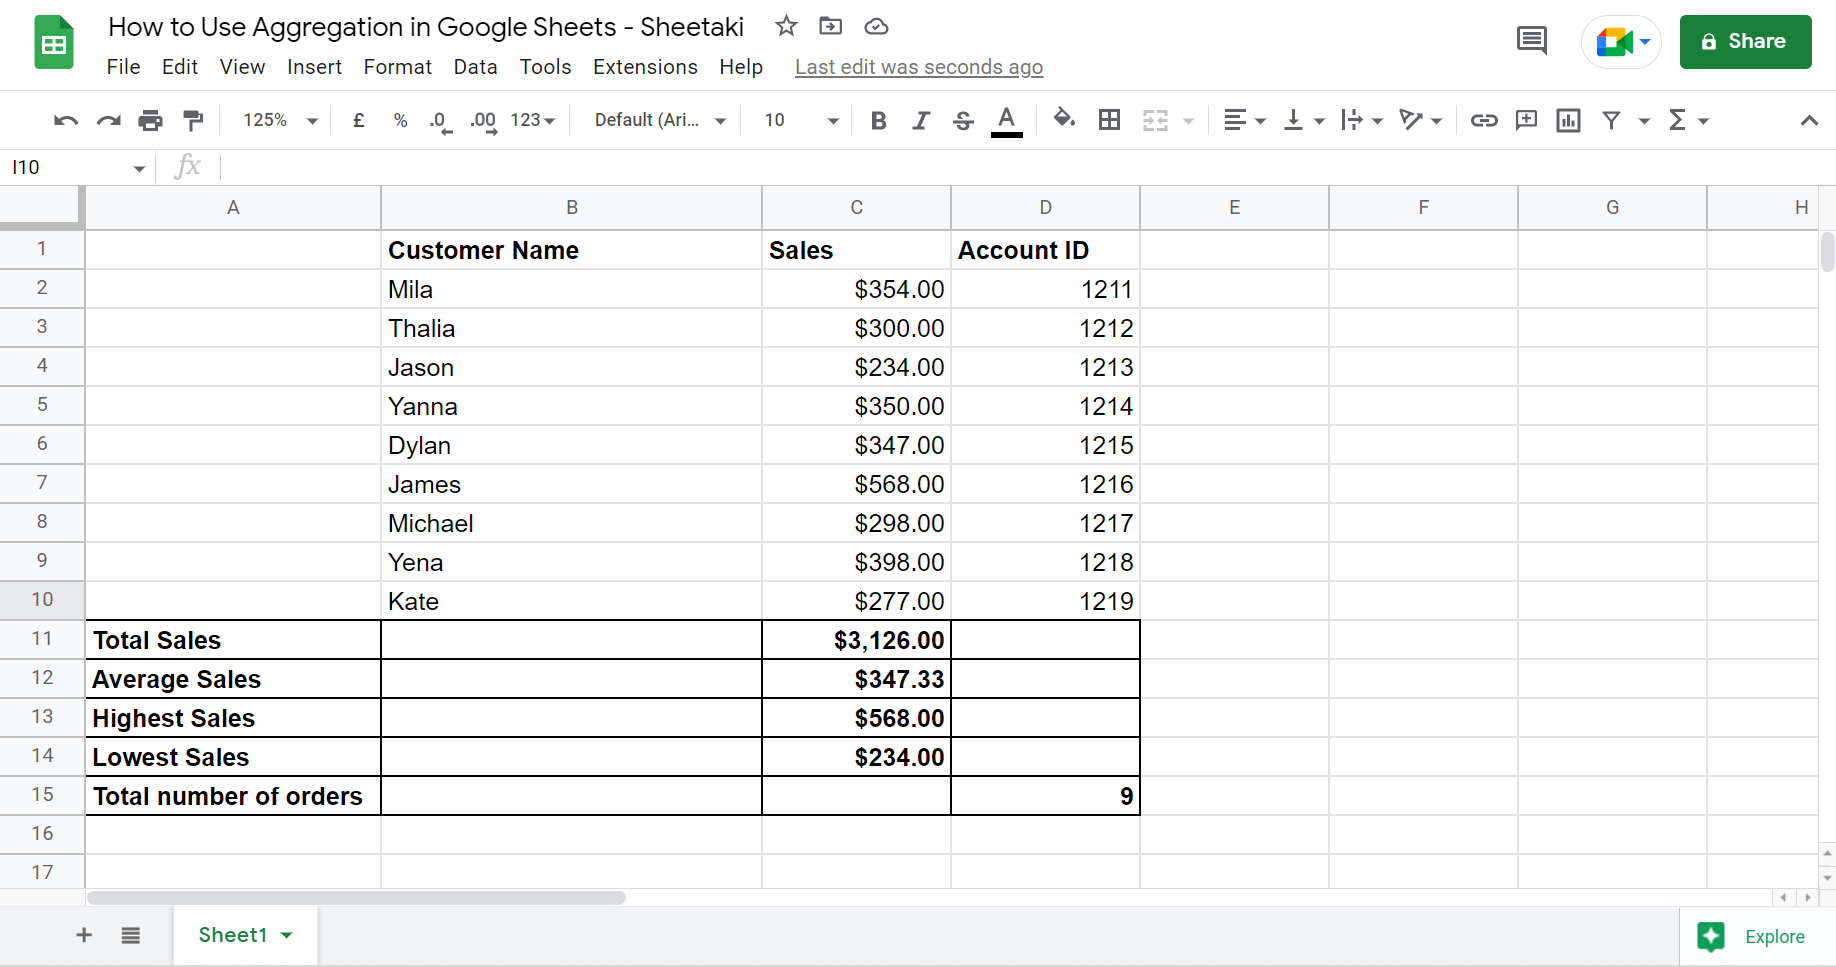
So a summary is placed below the dataset. Hence, you can immediately see important points in the data like the total or the lowest sales at a glance.
You can make your own copy of the spreadsheet above using the link attached below.
Now that you’ve seen what it would look like to use aggregation in Google Sheets, it’s time to learn the step-by-step process of how to do it in your own work. Let’s not waste any more time and proceed.
How to Use Aggregation in Google Sheets
This section will explain how to use aggregation using the different aggregate functions available in Google Sheets. Furthermore, images are provided to guide you along the way.
1. First, click on any cell where you want to place a table to show the aggregated data. For this guide, I selected A11, where I will start my table.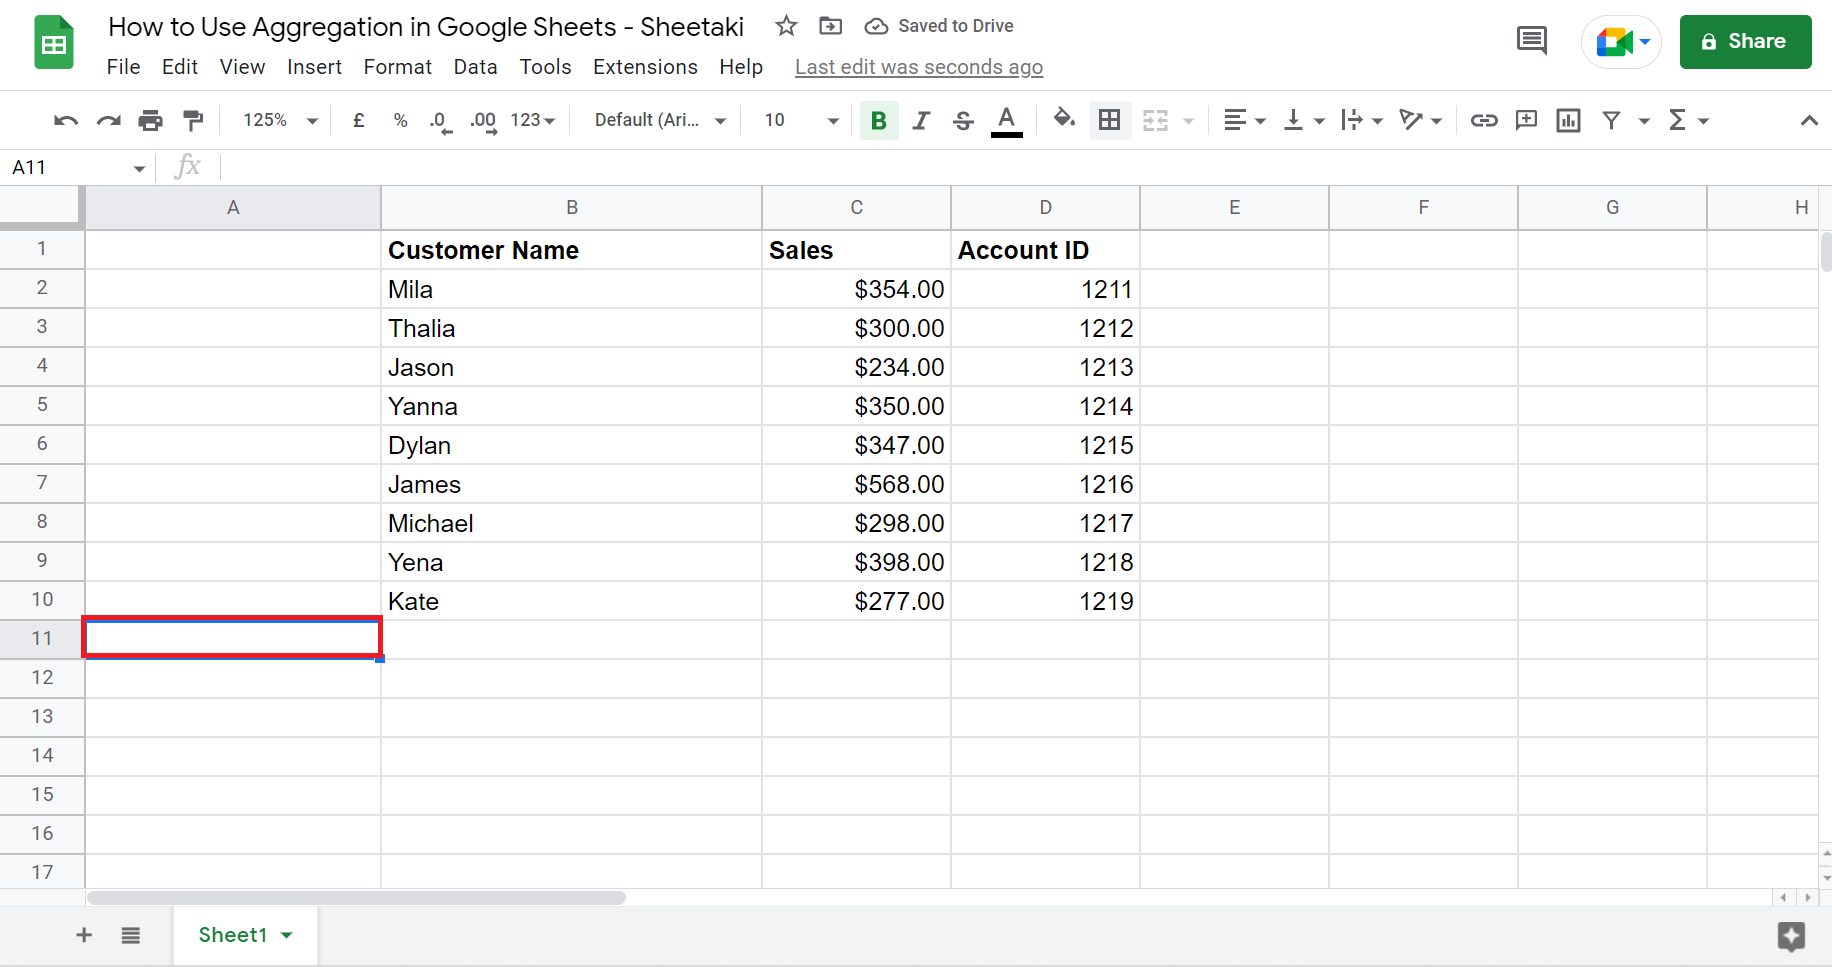
2. Let’s first calculate the total sales using the SUM function. So click any cell where you want to display this. Remember to type in the = to begin the function. After clicking SUM, select the cells you want to add together. Lastly, press Enter to show the result.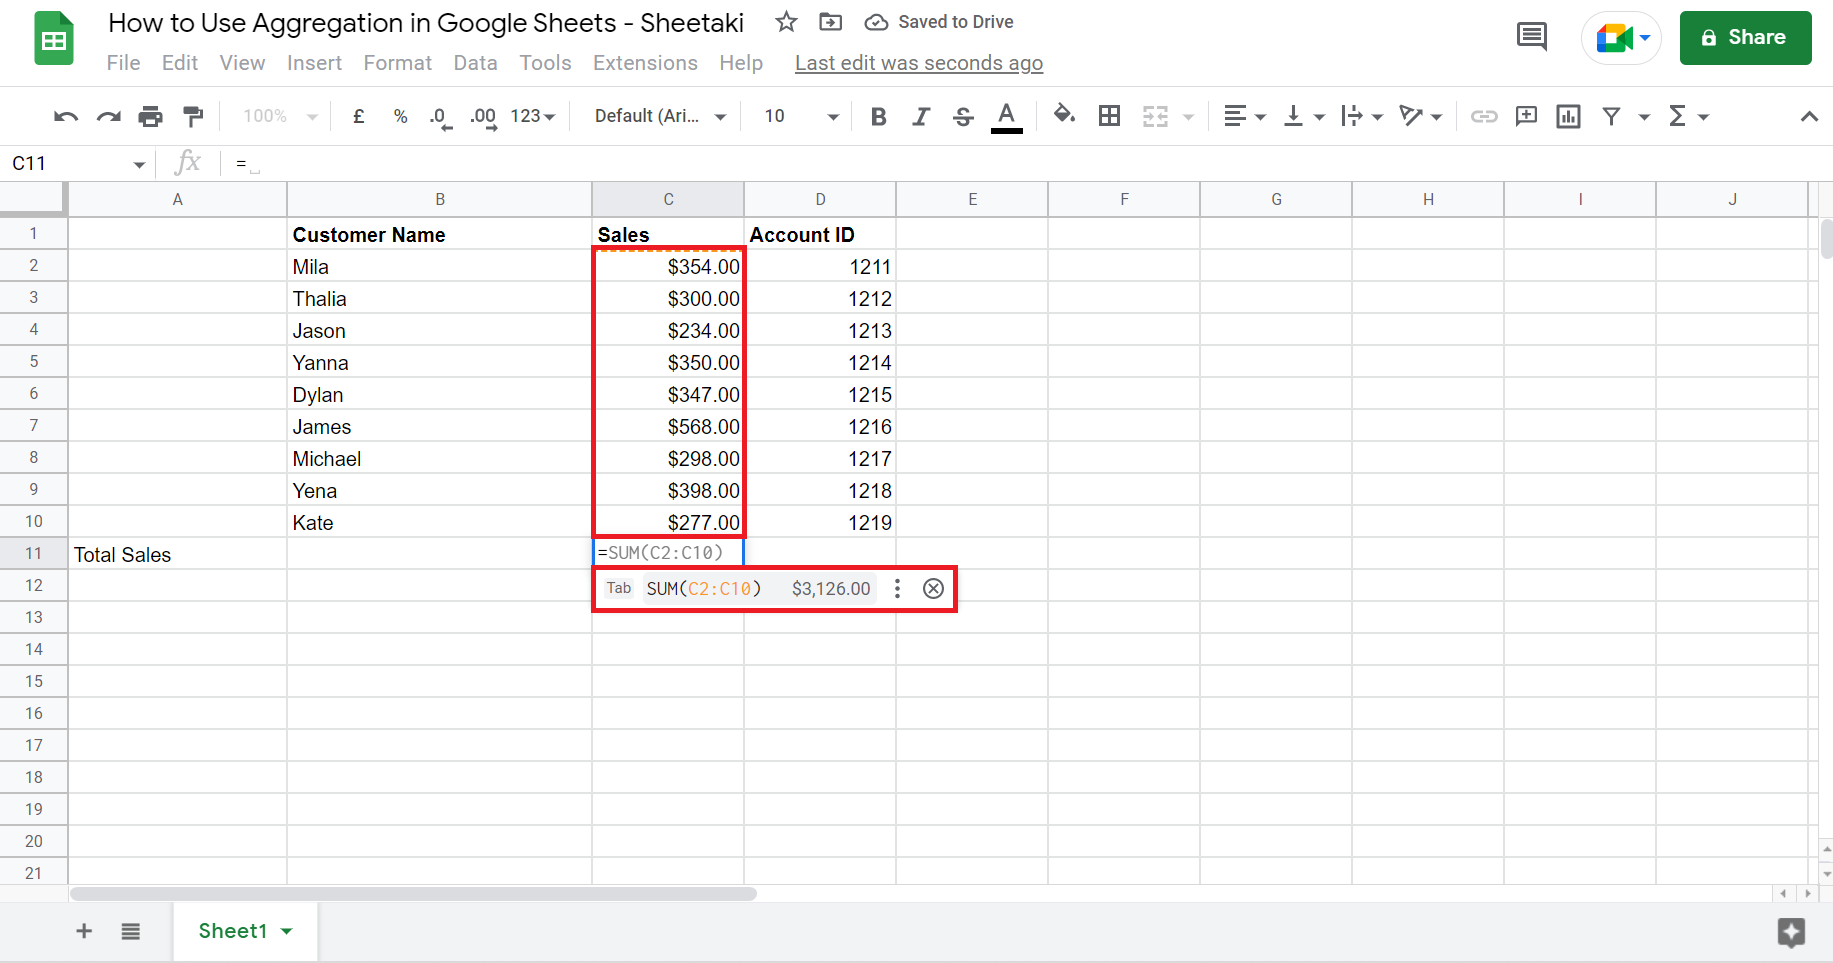
3. Next, let’s calculate the average sales using the AVERAGE function. Again, simply type in the = sign to begin the function. Also, you can just type in ‘Average’, and it will appear. And it usually remembers or provides the cells it thinks you will use. If not, just select the cells you want to use. 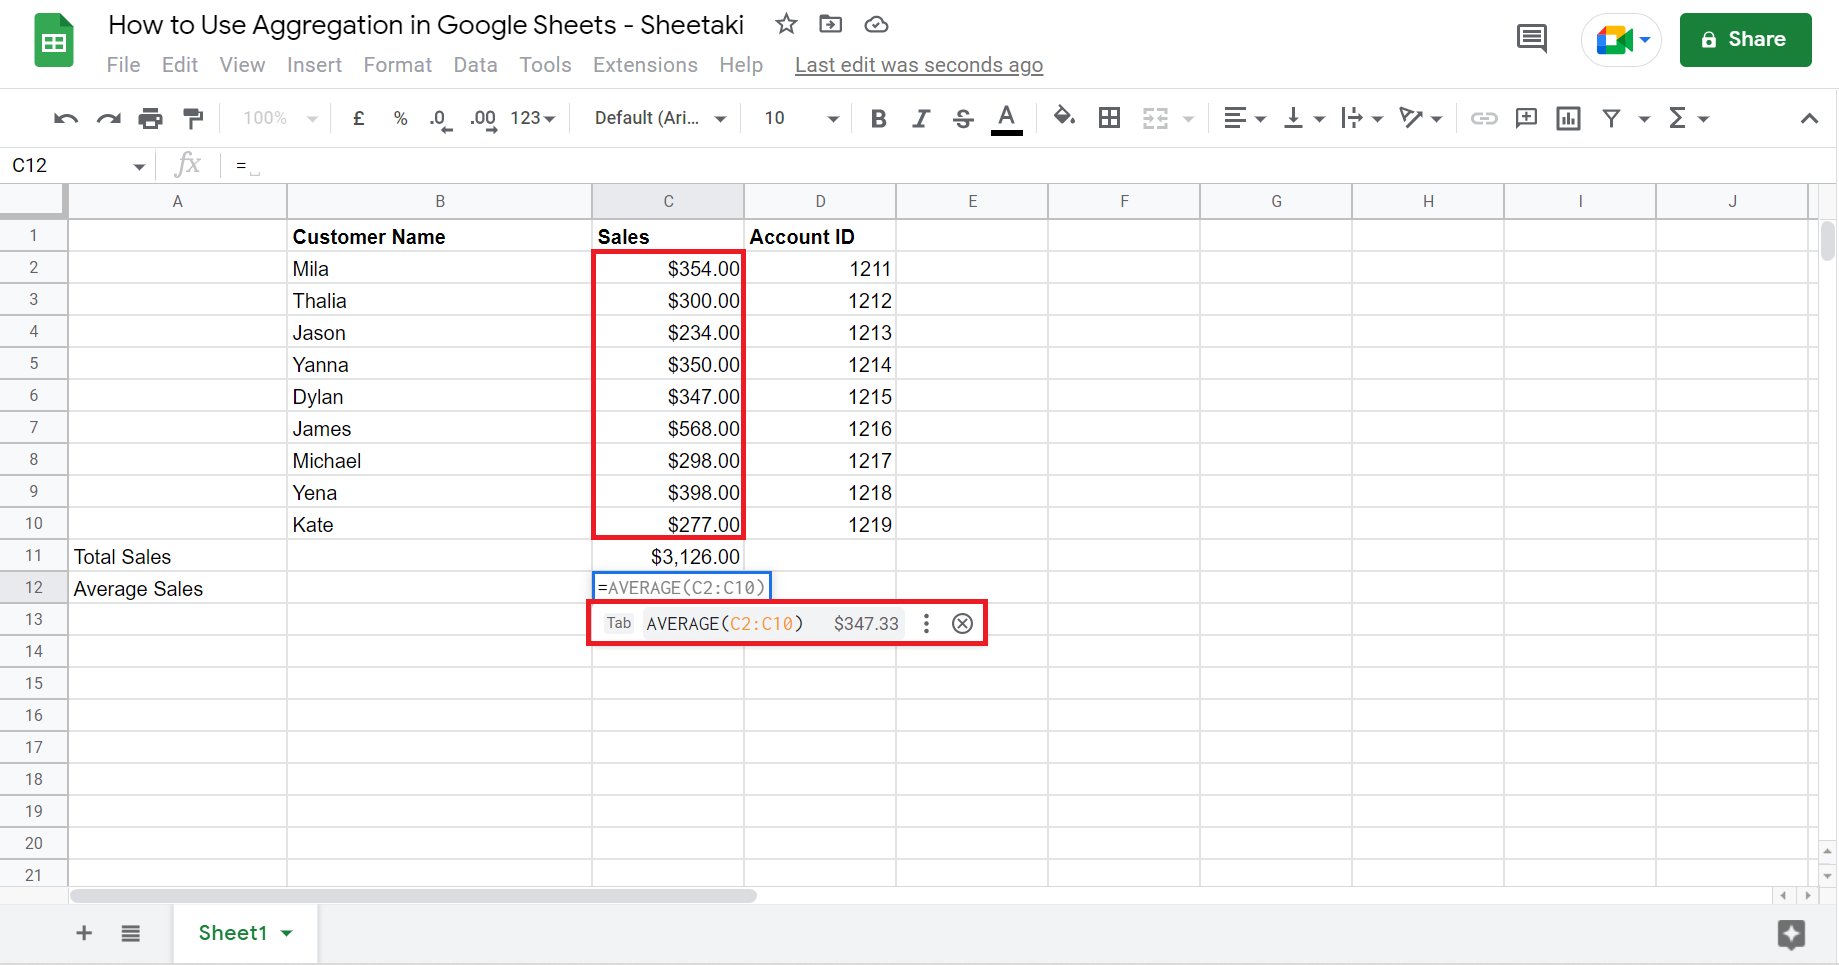
4. Now, let’s find the highest sales using the MAX function. Repeat the same process as previous functions. Type in the ‘=‘ sign, and click MAX. Then, select the cells you want to use and press Enter.
5. Next, let’s identify the lowest sales using the MIN function. Again, follow the same process. Furthermore, Google Sheets is a smart tool, so it can sometimes predict what function you will be using based on what you have previously typed. Since you typed in the lowest sale, it predicted you would be using the MIN function.
6. Lastly, let’s calculate the total number of orders using the COUNT function. For this part, I selected a cell under the Account ID column since that’s the dataset I will be using. 
Again, same process. Type in the = sign and search for the COUNT function. Then, click COUNT and select the cells that contain the values you want to count. Finally, press enter to show the result.
7. And tada! You have created a table for your aggregated data.
That’s pretty much it! You can now use aggregation in Google Sheets to create a summary of your data for better analysis. Wasn’t this easy? Of course, just use these aggregate functions in Google Sheets whenever necessary and make your work easier.
Are you interested in learning more about what Google Sheets can do? Make sure to subscribe to our newsletter to be the first to know about the latest guides and tutorials from us.