We can use the NORM.DIST function to calculate NormalCDF probabilities in Excel.
The NORM.DIST function allows users to evaluate the cumulative distribution function of a normally distributed random variable.
Users who have used a TI-84 calculator may be familiar with the normalcdf function. This function returns the cumulative probability of a given range, assuming a normal distribution.
For example, you can use the normalcdf command to find the probability that the variable will fall between 50 and 75 given a normal distribution with a mean of 60 and a standard deviation of 3.
This can be computed using the following function:
normalcdf(50,75, 60, 3)
However, you may want to use a similar formula in Microsoft Excel.
Let’s take a look at a quick example! Suppose you know that a random variable follows a normal distribution with a mean of 10 and a standard deviation of 1. You want to know the probability that the random variable falls between 4 and 6.
You also want to know the probability that the same random variable falls below 3.
We can use the NORM.DIST formula in Excel to find the cumulative probability of an interval in a normal distribution.
The NORM.DIST function returns the probability that a variable x falls below or at an indicated value.
Now that we know when to calculate the cumulative distribution function using NORM.DIST, let’s learn how to use it on an actual sample spreadsheet.
A Real Example of Using NormalCDF Probabilities
The following section provides several examples of how to calculate probabilities using the normal cumulative distribution function. We will also explain the formulas and tools used in these examples.
First, let’s take a look at a sample problem where we are asked to calculate the probability.
Suppose you have a random variable that follows a normal distribution. You know that the distribution has a mean of 60 and a standard deviation of 3.
How can we find out the probability that a random value from the distribution falls between 50 and 75?
The spreadsheet below aims to find the probability.
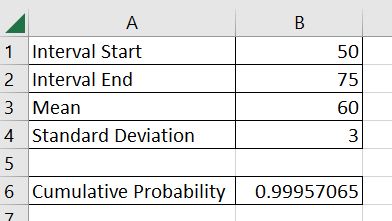
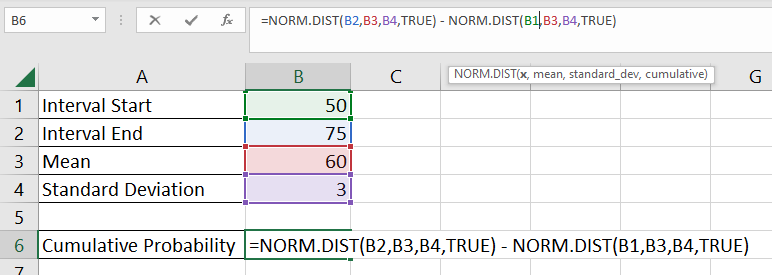
To get the values in B6, we just need to use the following formula:
=NORM.DIST(B2,B3,B4,TRUE) - NORM.DIST(B1,B3,B4,TRUE)
Do you want to take a closer look at our examples? You can make your own copy of the spreadsheet above using the link attached below.
If you’re ready to try calculating probabilities using a normal CDF, head over to the next section to read our step-by-step breakdown on how to do it!
How to Calculate NormalCDF Probabilities in Excel
This section will guide you through each step needed to calculate NormalCDF probabilities in Excel.
Follow these steps to start using the NORM.DIST function to solve probability problems involving normally-distributed random variables:
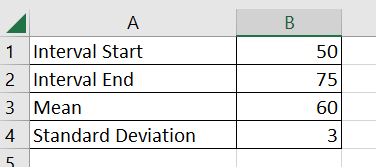
- First, write down the given values of the cumulative distribution problem. In this example, we want to determine the probability that a random variable will return a value between 50 and 75. The random variable is known to have a mean of 60 and a standard deviation of 3.
- Type ‘NORM.DIST(‘ to start the
NORM.DISTfunction. We’ll use this function to return the cumulative probability of a normal distribution.

- We’ll first use the cumulative distribution function to find how likely it is that the random variable returns a value less than or equal to 75.

- Next, we’ll subtract the first probability with the probability that the random variable returns a variable less than 50. The difference between these two variables will equal the probability of the random variable falling within the stated interval.
- Hit the Enter key to evaluate the formula. In this example, we find out that there is a 99.957% chance that the random variable falls within the described interval.
- Next, we’ll explain how to use the
NORM.DISTformula to determine probabilities that a random variable returns a value greater than or less than some value. In these examples, we have a value X where we’ll evaluate the cumulative distribution function.

- We’ll first look for the probability our random variable returns a value greater than 20. We can find this probability by subtracting the cumulative probability at 20 from 1.
 Similar to the previous example, we’ll use the
 NORM.DISTfunction to evaluate the cumulative distribution function at the given x. - Hit the Enter key to evaluate the formula. In this example, we find that the probability our random variable returns a value greater 20 is 99.99%.

- If we want to find the probability that the random value falls below x, we can just use the
NORM.DISTfunction as is.

These are all the steps needed to calculate the NormalCDF probabilities in Excel.
This step-by-step guide should provide you with all the information you need to calculate the NormalCDF probabilities in Excel.
You should now be able to use the NORM.DIST function to find cumulative probabilities. This includes finding the probability a random variable is greater than or less than a specified value. We can also use NORM.DIST to find the probability the variable falls between two values.
This function is just one example of the many Excel functions you can use in your spreadsheets. Our website offers hundreds of other functions and methods to help you get more out of Microsoft Excel.
With so many other Excel functions available, you can find one appropriate for your use case.
Don’t miss out on our team’s new spreadsheet tips, tricks, and best practices. Subscribe to our newsletter to stay updated on the latest guides from us!