


This guide will explain how to calculate a sigmoid function in Excel.
The sigmoid function’s S-shaped curve is often helpful for models such as logistic regression.
Every function has a set of numbers called a domain, and another set called a range. The domain refers to the set of all possible input values, while the range refers to the set of all possible outputs of a given function.
The sigmoid function is also known as the squashing function because it has a special property. The domain encompasses all real numbers but only has a range from 0 to 1.
This property makes sigmoid functions useful in machine learning models that require a real number to be converted into a probability. For example, we use the sigmoid function in binary classification to predict the probability of a binary variable.
Suppose you are a bank that wants to predict whether a borrower will default on a loan. You can use a sigmoid function to create a model that outputs either a 0 or 1. An output of ‘1’ indicates that the borrower is likely to default.
Sigmoid functions are also often used in financial data modeling and predicting future cash flow in a business. They are also used in various fields that require transforming analog measurements into digital information.
We can create our own sigmoid function in Excel by using a custom formula. Later in this guide, we will compute the sigmoid function and graph it using a scatter plot to visualize the s-shaped curve.
Now that we have an idea of when to use the sigmoid function, let’s learn how to use it on an actual sample spreadsheet.
A Real Example of Using the Sigmoid Function in Excel
The following section provides several examples of how to use this function. We will also go into detail about the formulas and tools used in these examples.
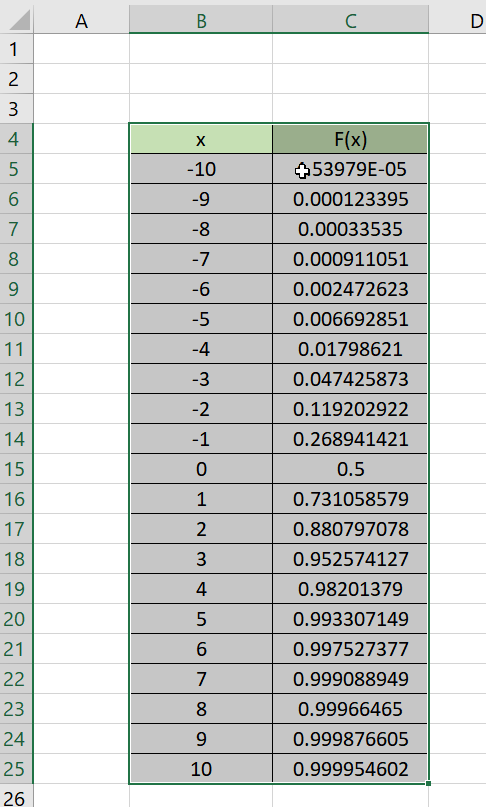
First, we’ll create a list of x values that increment by 1. We’ll create another column called f(x) that will hold the result of our sigmoid function.

After transforming each x into a real number from 0 to 1, we’ll use both columns to plot the sigmoid function into a scatter graph with smooth lines.
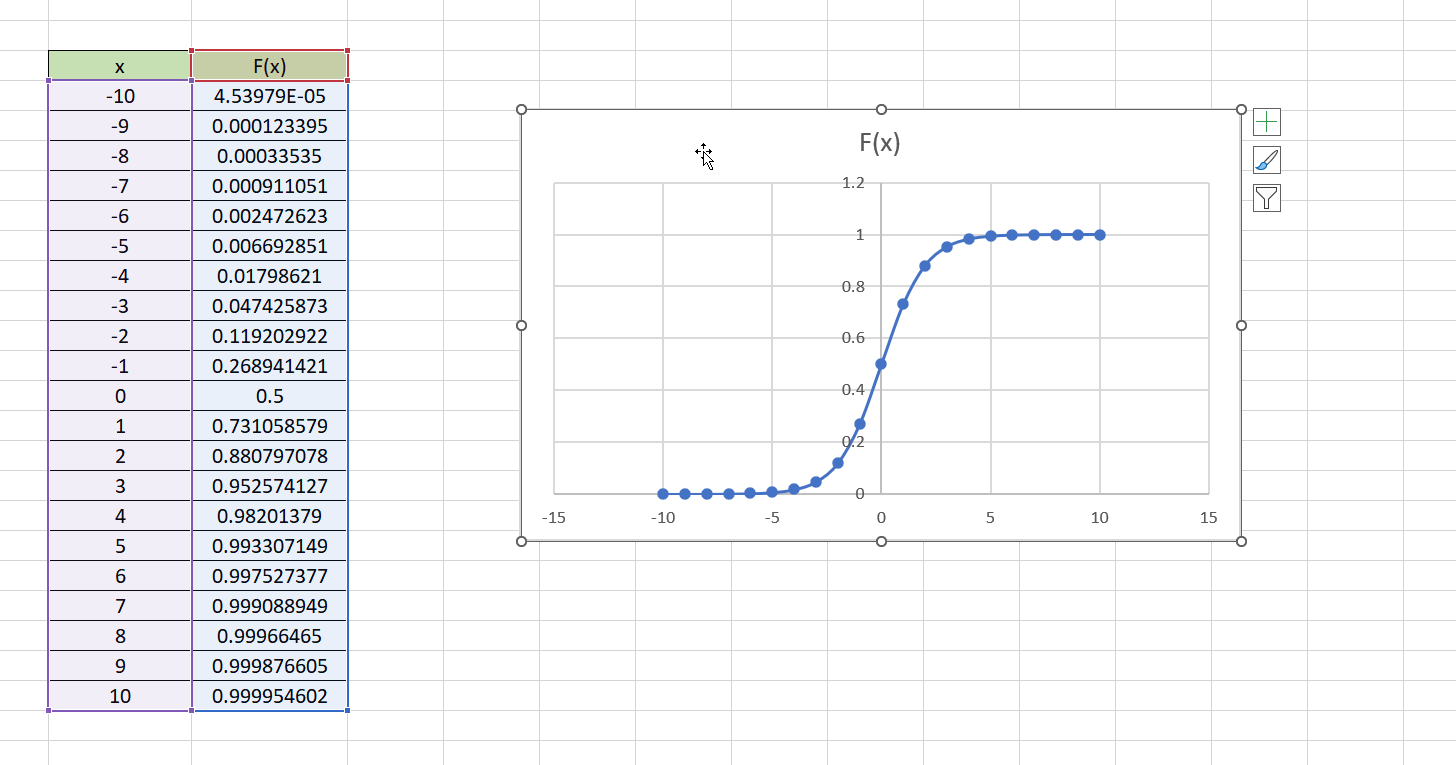
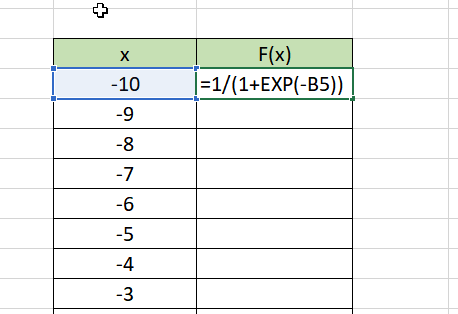
To create the sigmoid function in Excel, we used the following formula:
=1/(1+EXP(-B5))
Do you want to take a closer look at our examples? You can make your own copy of the spreadsheet above using the link attached below.
Use our sample spreadsheet to test out how the plot may look with a different range of x values.
If you’re ready to try calculating the sigmoid function yourself, head over to the next section to read our step-by-step breakdown on how to do it!
How to Calculate a Sigmoid Function in Excel
This section will guide you through each step needed to start using a custom formula to calculate the sigmoid function.
Follow these steps to start using the sigmoid function in Excel:
- First, select the cell that will hold the sigmoid formula. In this example, we’ll start with cell C5. Past the sigmoid formula mentioned in the previous section. Replace the cell reference B5 with the cell reference of the x value you’re using as input.
- Hit the Enter key to evaluate the result.
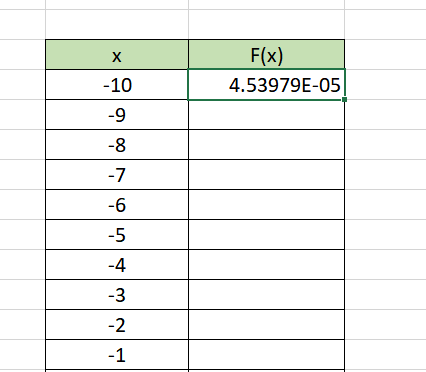
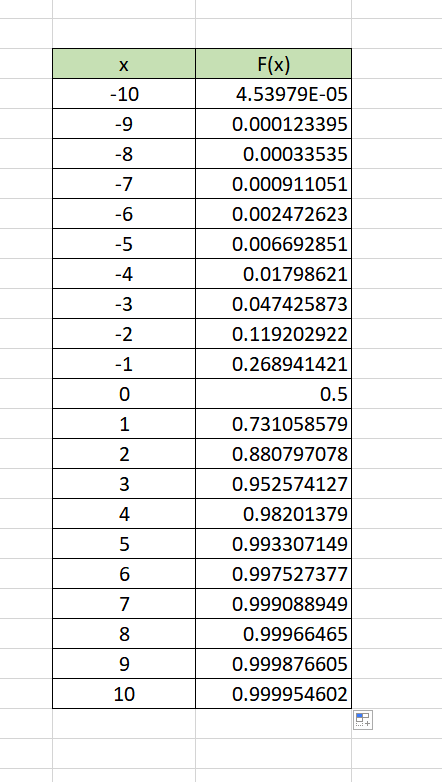
- Use the Fill Handle tool to drag the formula down to fill the rest of the second column. The values should now approach closer to 1 as it approaches positive infinity.
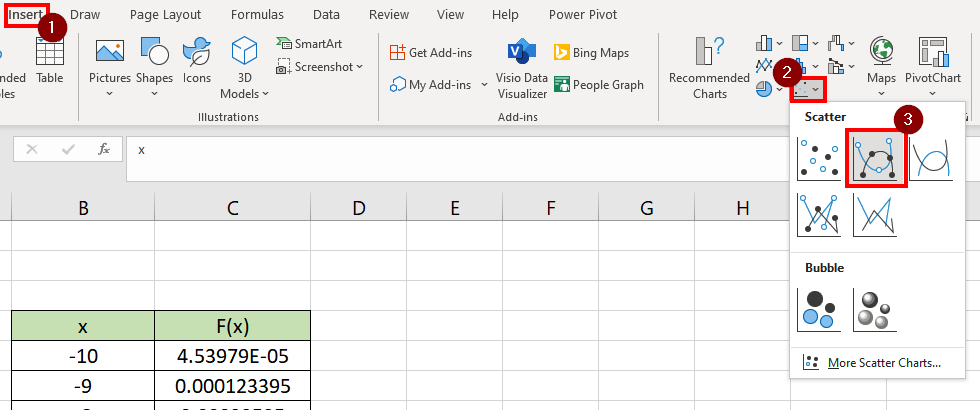
- Next, we’ll use Excel’s built-in charts to plot the S-curve. We’ll first select both the input and output values.
- In the Insert tab, click on the Scatter chart icon and select the option with smooth lines.
- You should now have a plot of the sigmoid function’s S-curve.
These are all the steps needed to calculate the sigmoid function in Excel.
Frequently Asked Questions (FAQ)
- What is logistical regression and how does it use the sigmoid function?
Logistic regression is a predictive model aiming to output discrete values. This means that the model must either output a 0 or 1. Logistic regression models use sigmoid functions often because it allows the model to output either a 0 or 1. In this scenario, the sigmoid function acts as an activation function.
This step-by-step guide should provide you with all the information you need to calculate the sigmoid function in Excel.
We’ve shown how the sigmoid function can convert a range of values into a value between 0 and 1. Using Excel’s scatter plot feature, we were also able to plot the function’s S-curve.
This function is just one example of the many Excel functions you can use in your spreadsheets. Our website offers hundreds of other functions and methods to help you get more out of Microsoft Excel.
With so many other Excel functions available, you can find one appropriate for your use case.
Don’t miss out on our team’s new spreadsheet tips, tricks, and best practices. Subscribe to our newsletter to stay updated on the latest guides from us!


