


This guide will explain how to perform exploratory data analysis in Excel.
Exploratory data analysis is typically the first step in any project that involves a large dataset. We’ll explain how you can go through this process using built-in Excel tools.
Exploratory data analysis is the process of making initial investigations into data to discover patterns, identify anomalies, and decide on appropriate statistical models and techniques.
The most common stages of exploratory data analysis are data preparation, data visualization, and statistical modeling. Data preparation involves cleaning and formatting the data. Data visualization involves creating graphs and charts to explore the data visually. Statistical modeling involves using statistical techniques to find patterns in the data.
Let’s take a look at a simple example where we can perform exploratory data analysis.
Suppose we want to create a data model to predict population growth for a particular region. We have a census dataset with over 50,000 rows that covers over fifty years of population growth.
Exploratory data analysis may be used when a data set is too large to analyze by looking at it manually. In this case, exploratory data analysis can be used to summarize the main characteristics of a dataset.
For instance, you may want to know which years and regions had the highest population growth or the lowest population growth. You may also want to visualize the distribution between fast-growing and slow-growing regions.
Excel offers multiple statistical functions that you can use for the exploratory data analysis process. For example, we can use the QUARTILE functions to determine the lower and upper quartiles. These values can give us insight into the data distribution in each field of our dataset.
Now that we have a grasp on when to use the exploratory data analysis, let’s see how this works on an actual sample spreadsheet.
A Real Example of Exploratory Data Analysis in Excel
The following section provides several examples of how to use exploratory data analysis in Excel. We will also go into detail about the formulas and tools used in these examples.
First, let’s take a look at our sample dataset. In this example, we have real estate data that we hope to use to predict prices given the number of bedrooms or areas of the property.

We’ll use Excel functions to return a statistical summary of each field in our dataset.

The QUARTILE function can be used to calculate the first, second, and third quartiles of a data set. The MIN and MAX functions can be used to find the minimum and maximum values in a data set.
The COUNT function can be used to count the number of cells that contain numeric data. The AVERAGE function can be used to calculate the average of a data set.
Histograms are a type of graph that can be used to visualize the most common house prices. Converting the column of house prices into a histogram can tell us more about the shape of our distribution.
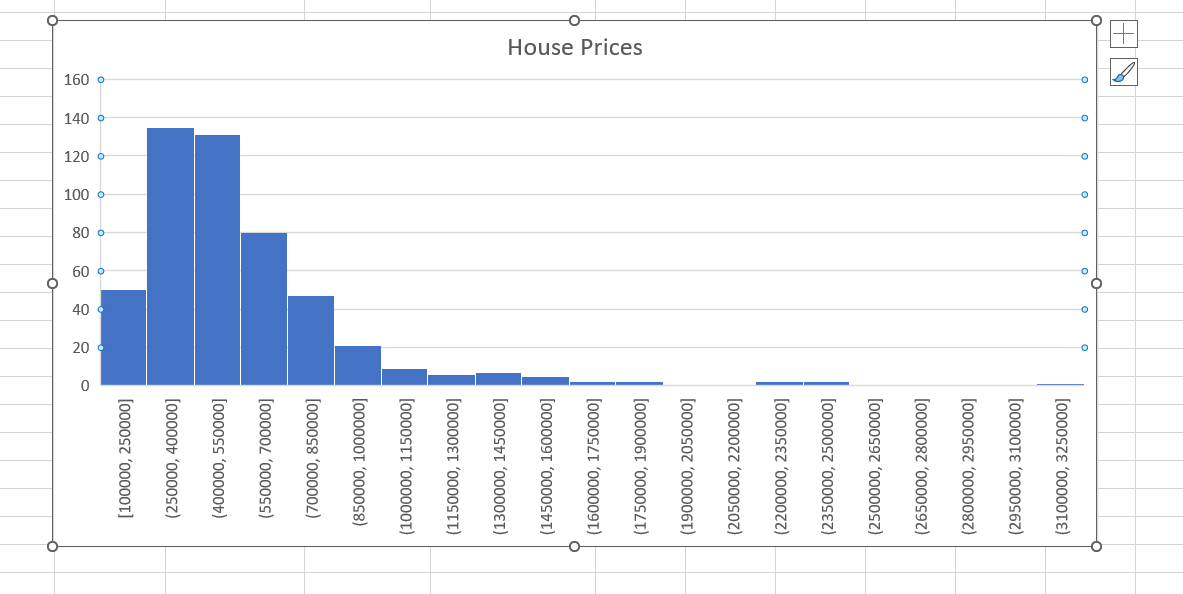
In the histogram we’ve generated, we can conclude that the majority of houses are within the price range of $250,000 and $550,000.
Do you want to take a closer look at our examples? You can make your own copy of the spreadsheet above using the link attached below.
If you’re ready to try out exploratory data analysis, head over to the next section to read our step-by-step breakdown on how to do it!
How to Perform Exploratory Data Analysis in Excel
This section will guide you through each step needed to use exploratory data analysis in Excel. You’ll learn how to use different statistical functions to create a summary of each field. We’ll also show you how we generated the histogram seen earlier.
Follow these steps to start performing exploratory data analysis:
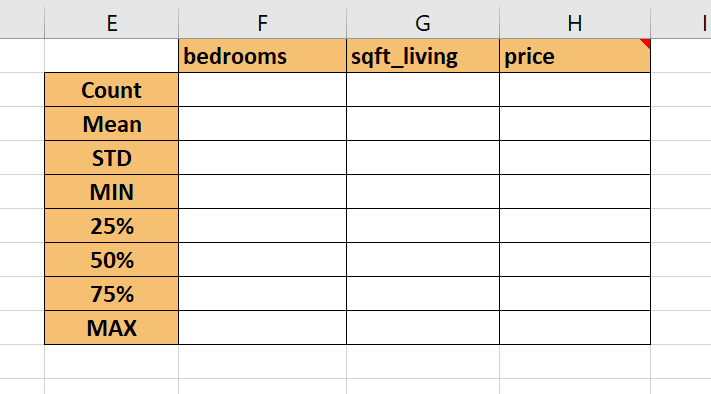
- First, let’s create a table to hold our summary data. The row headers will include each statistical property we want to compute. Each field in our dataset will have its own column.
- Let’s start by filling out the ‘bedrooms’ field. We’ll use the
COUNTfunction to retrieve the number of total values in that field.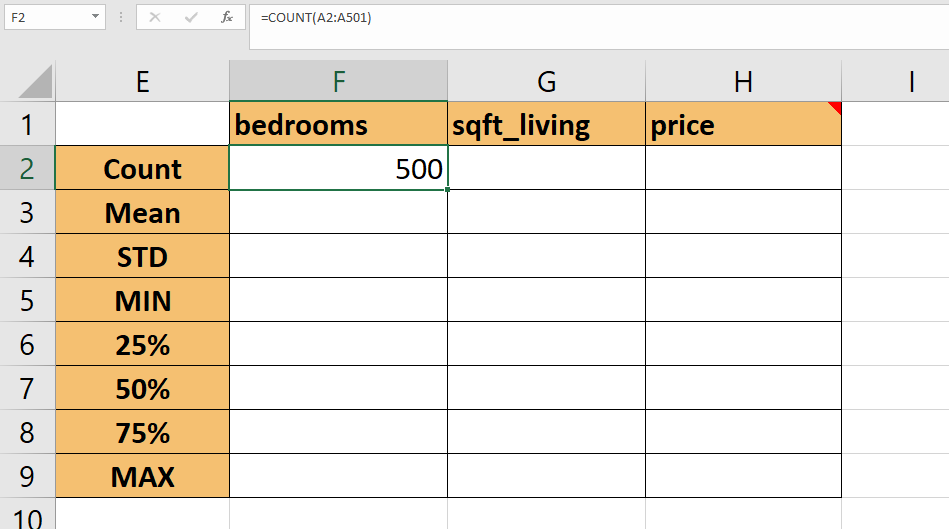
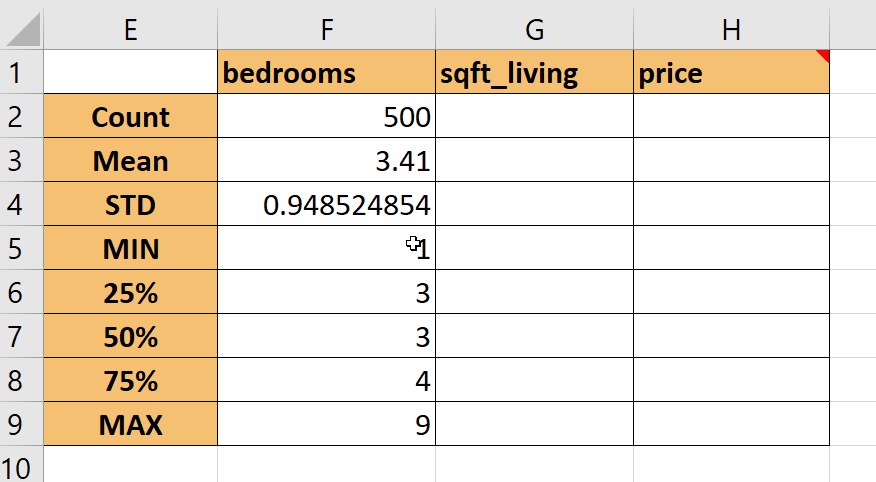
- Next, we’ll use the
AVERAGEfunction to obtain the mean. If your field contains categorical data, you may want to retrieve the mode of the field instead.

- Next, we’ll compute the standard deviation using
STDEV.S. We use this version of the function for samples.
- We can determine the minimum values by using the
MINfunction.

- We’ll use the
MAXfunction to find the largest value in the current field.

- Rows 6,7, and 8 refer to the three-quartile values. We’ll use the
QUARTILEfunction to generate these values. To get the lower quartile, we’ll need to use ‘1’ as our second argument.

- We can get the 50% quartile and 75% quartile through the
QUARTILEfunction again. We must replace the second argument with either ‘2’ or ‘3’.
- Next, we’ll use the Fill Handle tool to summarize the remaining fields in our summary table.
- Next, we will focus on visualizing a particular field in our dataset. In this example, we’ll try to convert our price field into a histogram. Select the entire range with our price data.

- In the Insert tab, click on the first Histogram option.

- You should now have a visualization of the chosen field as a histogram.
Frequently Asked Questions (FAQ)
- What are some benefits of performing exploratory data analysis in Excel?
Some benefits of performing exploratory data analysis in Excel include being able to find trends or patterns in the data quickly, being able to identify outliers, and being able to gain a better understanding of the data set as a whole.
This step-by-step guide should provide you with all the information you need to begin performing exploratory data analysis in Excel.
This procedure is useful for users who want to create a summary of a large dataset.
There are even more statistical functions you can use in your Excel spreadsheets. Our website offers hundreds of other functions and methods to help you get more out of Microsoft Excel.
With so many other Excel functions available, you can find one appropriate for your use case.
Don’t miss out on our team’s new spreadsheet tips, tricks, and best practices. Subscribe to our newsletter to stay updated on the latest guides from us!


