This article will explain how to use hypergeometric distribution in Excel.
We can use this type of distribution to calculate the probability of obtaining a certain number of successes from a population without replacement.
The hypergeometric distribution is a type of discrete probability distribution. It can calculate how likely an event could happen k times in n trials in a population without replacement.
Unlike a binomial distribution, the hypergeometric distribution factors in how probabilities may change if the population is not constant.
Let’s take a look at a quick example of a situation where we can use hypergeometric distribution.
Suppose you have a regular deck of cards. You want to know how likely it is to draw four aces from the deck.
In this example, we’re concerned with the event of picking out an ace from the deck. If we want to find the probability of this event occurring four times, we can use Excel’s HYPGEOM.DIST function to model a hypergeometric distribution.
We’ll need to know four values to compute the probability: the size of our sample, the number of successes in the sample, the number of successes in the population, and the overall population size.
We can plug in these values to our HYPGEOM.DIST function to return the probability of drawing four aces from a deck of cards.
This use case is just one way to use the HYPGEOM.DIST function in Excel. You may use this function for any scenario where you’ll be sampling without replacement from a finite population.
For example, if we’re drawing red and blue marbles from a bag, the probability of picking a red marble changes every time you draw a marble.
Now that we know when to use the hypergeometric distribution, let’s learn how to use it and work on an actual sample spreadsheet.
A Real Example of Using Hypergeometric Distribution in Excel
The following section provides several examples of how to use the HYPGEOM.DIST function. We will also explain the formulas and tools used in these examples.
First, let’s describe our sample scenario. We have a regular deck of cards, and we plan on drawing five cards randomly. We want to know the probability of drawing at least three aces from the deck.
First, let’s fill out some of the given values of our sampling problem. We know that a deck of cards has 52 cards and that each deck has 4 aces. In this example, drawing an ace is known as a ‘success’. The number of successes in our population is 4, and the number of successes we want in our sample is 3.

After determining these properties, we can now use the HYPGEOM.DIST function to compute the probability. Our formula indicates that there is a 0.17% chance that drawing five cards will return three aces.
We can find this probability by using the following formula:
=HYPGEOM.DIST(B11,B10,B13,B12,FALSE)
In this second example, we are drawing from a bag of eight marbles. The bag contains three marbles of our preferred color. If we draw four marbles randomly from the bag without replacement, how likely is it to draw two marbles of our preferred color?

We’ll use the HYPGEOM.DIST function again to find the probability.
Do you want to take a closer look at our examples? You can make your own copy of the spreadsheet above using the link attached below.
If you’re ready to try using hypergeometric distribution yourself, head over to the next section to read our step-by-step breakdown on how to do it!
How to Use Hypergeometric Distribution in Excel
This section will guide you through each step needed to begin using the HYPGEOM.DIST function in Excel. You’ll learn how to use this function to find the probability or drawing k successes after n draws from a finite population.
In this example, we want to know the probability of drawing two red balls from a bag. We’ll draw a random sample of four balls from a bag containing three red balls, 2 blue balls, and three yellow balls.
Follow these steps to start using the hypergeometric distribution in Excel:
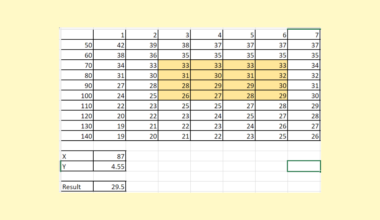
- First, create a table that will hold the four values we need to compute the probability.

- Since we’ll sample four balls from our population, we’ll use 4 as our sample size. We’ll place 2 as the number of successes we want in our sample.

- Our bag contains a total of 8 balls, with three of those being our preferred color.

- Next, select a new cell where we’ll place our
HYPGEOM.DISTfunction. In this example, we’ll use cell B6.

- We’ll add the values in our table as arguments to our function. The first argument will be the number of successes in our sample, followed by the sample’s size. Our third and fourth arguments should be the number of successes in our population followed by the size of our population.

- Hit the Enter key to evaluate the function. In this example, we’ve determined there is a 42.86% chance we’ll draw two red balls from our bag.

These are all the steps needed to use hypergeometric distribution in Excel.
This step-by-step guide should provide you with all the information you need to begin using the hypergeometric distribution for sampling problems without replacement.
The HYPGEOM.DIST function computes for the probability of k successes after n draws in a finite population of size N.
The HYPGEOM.DIST function is just one example of the many Excel functions you can use in your spreadsheets. Our website offers hundreds of other functions and methods to help you get more out of Microsoft Excel.
With so many other Excel functions available, you can find one appropriate for your use case.
Don’t miss out on our team’s new spreadsheet tips, tricks, and best practices. Subscribe to our newsletter to stay updated on the latest guides from us!