


This guide will explain how to add a running total to a Pivot Table in Excel.
Running totals can be a great measure of how a given metric changes over time.
Pivot tables are a powerful tool in Microsoft Excel that you can use to aggregate large datasets. A helpful feature of Excel Pivot Tables is the ability to display the value fields in various ways.
One of the most useful ways to display values is as a running total. Running totals, also known as cumulative sums, are a sequence of partial sums of a given dataset. The running total is primarily for displaying the growth of a value over time.
Let’s take a look at a sample situation where we can add a running total to an existing Pivot Table in Excel.
Suppose you have a dataset of credit card transactions that have been summarized using a Pivot Table. The Pivot Table shows the number of transactions per month in 2021.
We want to display a running total of the number of transactions in 2021. We can use the Value Field Settings dialog box to add a new running total field to our Pivot Table.
Now that we know when to use running totals in an Excel Pivot Table, let’s learn how to set it up on an actual sample spreadsheet.
A Real Example of Adding a Running Total to a Pivot Table
The following section provides several examples of how to add a running total to a Pivot Table in Excel. We will also explain the formulas and tools used in these examples.
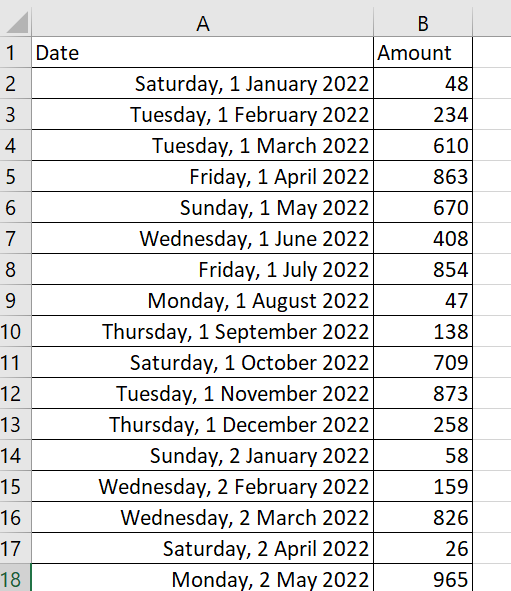
First, let’s take a look at our sample dataset. We have a table of transactions with an attached date and amount.
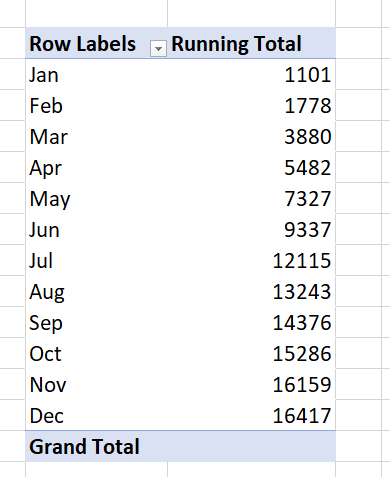
We’ve generated a Pivot Table to summarize the dataset for us. We now have a better idea of the amount transacted per month.

We can change our value field to display a running total instead. This view makes it easier to see the total year-to-date transacted amount at the end of any given month.
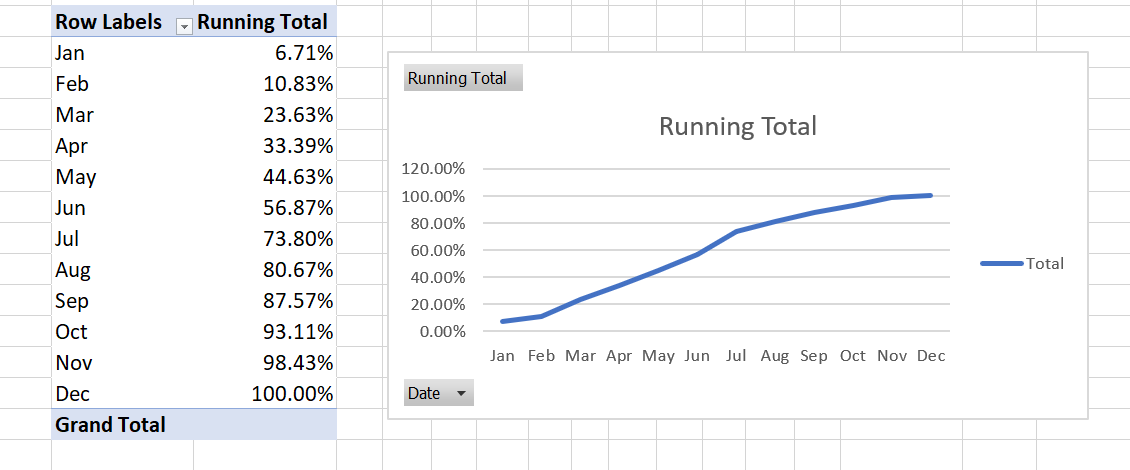
Users may also choose to display the running total as an interactive Pivot Chart. This may make it easier to track the growth in the running total throughout the year.
Do you want to take a closer look at our examples? You can make your own copy of the spreadsheet above using the link attached below.
If you’re ready to try adding a running total to a Pivot table in Excel, head over to the next section to read our step-by-step breakdown on how to do it!
How to Add a Running Total to a Pivot Table in Excel
This section will guide you through each step you need to add a running total to your Pivot Table. You’ll learn how we can use the Value Field Settings dialog box to show aggregate values as a running total.
Follow these steps to add a running total to a Pivot Table:
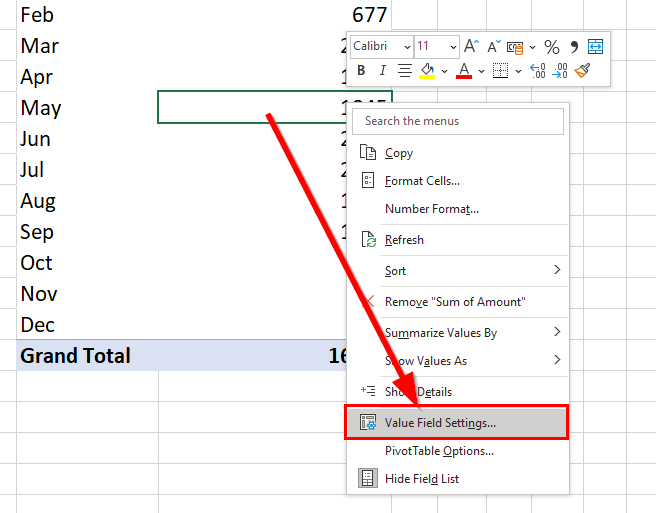
- Navigate to your Pivot Table and select any of the cells in a Value column. In this example, we’ll select a cell from a column that returns the sum of the Amount field for each month.

- Right-click on the cell and click the Value Field Settings option.
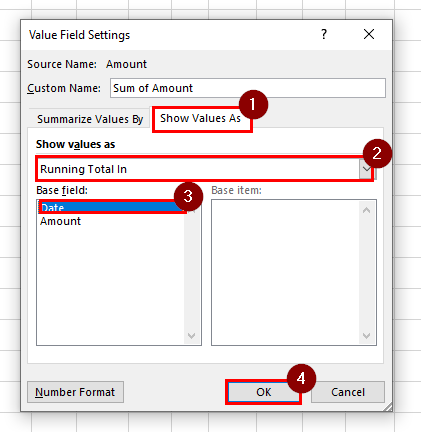
- Navigate to the Show Values As tab. Select Running Total In from the drop-down list and choose the base field. Click on OK to proceed.
- The selected column should now indicate the running total of the given source data field.
- We can also choose the % Running Total In option to display the running total.
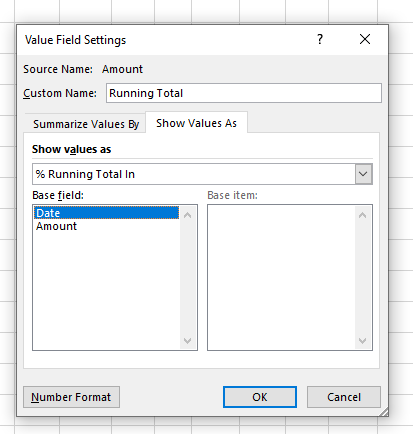
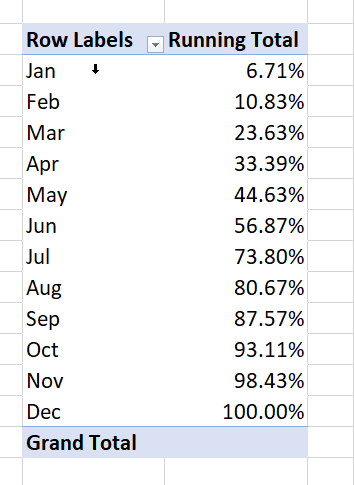
- Instead of showing the actual running total, the % Running Total In… option displays the cumulative sum as a percentage of the grand total.
- Next, we’ll show you how to create a Pivot Chart with a running total. Once you’ve set a running total field on your pivot table, select the entire table.

- In the Insert tab, click on the first 2-D Line chart option.

- Excel should now output a Pivot Chart that visualizes the growth of the running total over time.
These are all the steps needed to add a running total to a Pivot Table in Excel.
This step-by-step guide should provide you with all the information you need to add a running total to a Pivot Table in Excel.
We’ve shown you how to display the running total as either a partial sum or as a percentage of the grand total. We’ve also tried converting the pivot table into a pivot chart to have a better visualization of the running total.
Pivot Tables are just one example of the many Excel features you can use in your spreadsheets. Our website offers hundreds of other functions and methods to help you get more out of Microsoft Excel.
With so many other Excel functions available, you can find one appropriate for your use case.
Don’t miss out on our team’s new spreadsheet tips, tricks, and best practices. Subscribe to our newsletter to stay updated on the latest guides from us!


