Learning how to use the SLOPE function in Google Sheets is useful for measuring the slope of linear functions.
Table of Contents
For those who are not familiar, the slope of linear regression assesses the rate at which changes occur.
The slope measures the rate of change in the dependent variable when there is a change in the independent variable. The line will become steeper as the slope is greater.
There can also be a positive or negative slope. If the line moves upwards, it is a positive slope. If the line moves downwards, it is a negative slope. However, if the line is horizontal, it is a parallel slope.
A great example for the application of slope would be economists using slopes to consider how sensitive the demand of a product would be towards a price change.
Let us learn to use the SLOPE function in Google Sheet and apply it in real-life scenarios to understand better.
Anatomy of the SLOPE Function
The syntax of the SLOPE function is as follow:
= SLOPE(data_y, data_x)
Let us look at each term in the formula to understand what they mean:
=is the equal sign which is how we start any function in Google Sheets.SLOPE()is our SLOPE function. It measures the slope of linear regression derived from a dataset.data_yrefers to the range containing dependent values.data_xrefers to the range containing independent values.
A Real-Life Example of SLOPE Function in Google Sheets
Let us look at a real example of the SLOPE function used in Google Sheets.
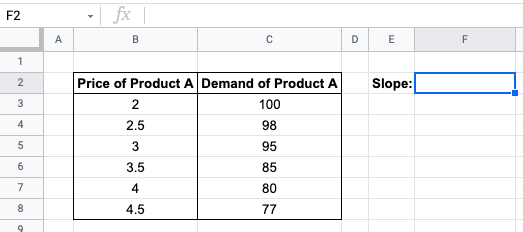
Imagine you are a student given an assignment for your Economics class. The assignment is to understand the relations of price to demand. Hence, you have created a survey for consumers to decide on a quantity they would purchase if the price of an item changes.
In this assignment, the price of product A will be the independent variable, and the demand of product A will be the dependent variable. The hypothesis is that if the price increases, the demand will decrease, causing a downward line. This also means it would be a negative slope.
In the example below, we have six data points for which we want to find the slope for this dataset.

Using the SLOPE function, we can get the value of slope for the dataset above.
Moreover, you may make a copy of the spreadsheet using the link I have attached below.
How to Use the SLOPE Function in Google Sheets
In this section, we will go through each step needed to use the SLOPE function in Google Sheets. This guide will show you how we can get the slope of the dataset seen previously.
Follow these steps to start using the SLOPE function:
- First, let us select the cell that will contain our SLOPE function result. In this example, we will select F2 to insert the formula in.
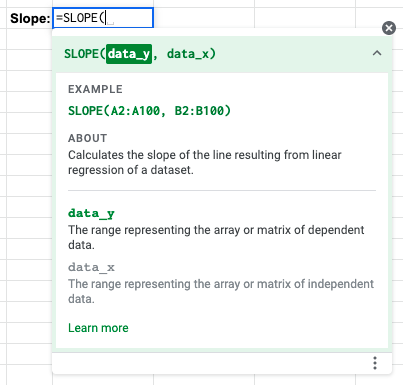
- Next, we simply type the equal sign
=to begin the function, followed bySLOPE(.

- You may find a pop-up box with a description of using the SLOPE function. We can click on the arrow located on the top-right-hand corner of the box to minimize it.
- Next, we will type in our arguments. We will select both ranges x and y. Don’t forget to close the formula with a closing bracket
).

- Once we press Enter, the slope calculated will be -10.23. This indicates that the line will be in a downward direction and is a negative slope.

As shown in the calculated slope for the dataset, our hypothesis set at the beginning of the assignment is correct.
How to Find the Slope of a Graph in Google Sheets
As shown above, the SLOPE function only helps us measure the slope of a dataset and does not help find the slope in a graph.
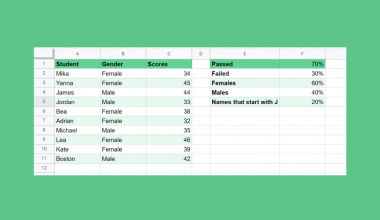
To demonstrate how we can find the slope of a dataset in a graph, let us create a scatter plot using the dataset shown above. If you are not familiar with creating a scatter plot, you can learn more from our tutorial!
- First, let us select the two columns which hold the variable we will be looking into.

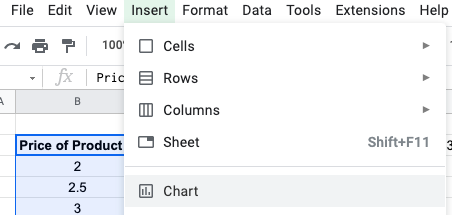
- Next, we click on the Chart option under Insert.
- Google Sheets will provide a chart in the middle of your sheet, along with a chart editor panel on the right-hand side.

- Next, select the Scatter chart option as the Chart Type on the Chart editor.

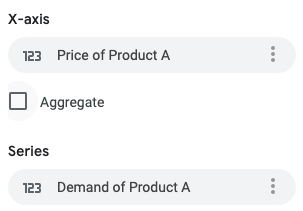
- Make sure that the X-axis and Series are correct. In this example, our X-axis is the Sale Price, and our Series or y-axis is the Demand.
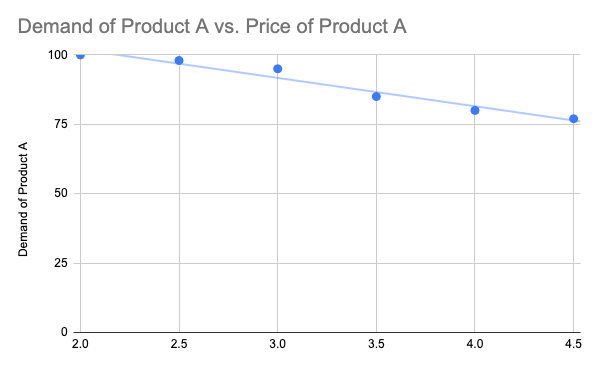
- Next, we can add a trendline to further emphasize the relationship between the two variables. In the chart editor, you can find the Trendline option under the Series section of the Customize tab. For this example, we added a blue linear trendline to our graph.

- Once we are done with the above steps, our scatter plot will look like this.
- To find the slope of this scatter plot, we simply select Use Equation for the label. An equation will appear on the graph, and the slope is shown.

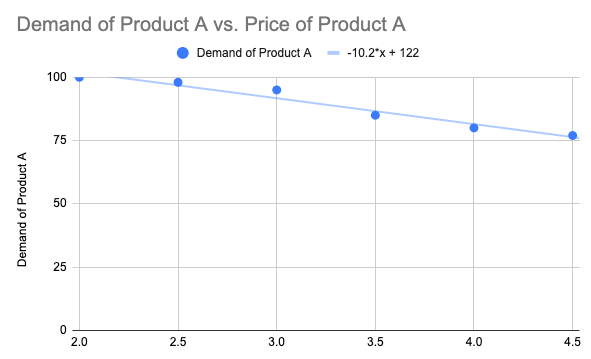
As you can see, the slope shown in the graph and also calculated by the SLOPE function are both -10.2.
There you go! Now you can easily find the slope of a dataset using the SLOPE function or by a graph. We hope that this tutorial has helped you if you are having trouble.
Don’t forget to check out other cool functions in Google Sheets to enhance and simplify work for your everyday use!
Make sure to subscribe to our newsletter to be the first to know about the latest guides and tutorials from us.