This guide will explain how to calculate variance in Excel using the different variance functions.
Excel has six different functions that calculate variance. Of course, each function technically calculates the variance but slightly differs from how it is used depending on data types and its treatment of string values.
In mathematics, variance is a type of central tendency that tells us the spread or how far our data set is from the mean (average). It is a tool often used for data analysis.
When our variance is zero, there is no variety in the data set. And when our variance is not zero, the numbers in the data set are likely to differ.
Manually calculating the variance can be difficult and time-consuming. So learning how to use the variance functions in Excel can make data analysis quick and simple.
Let’s take an example where you would need to calculate the variance.
Suppose you are conducting data analysis on the exam results for the students. So you want to determine how well the class performed in the exam as a whole by calculating the variance.
Since there are six variance functions in Excel, let’s learn the differences among them and how to choose the correct function based on our data and needs. From the six variance functions, we will focus on four variance functions: VAR.P, VAR.S, VARA, and VARPA.
How to Choose the Correct Variance Function in Excel
Excel has many types of variance functions at our disposal. It is crucial to choose the correct function to perform the data analysis successfully. While the VAR.P, VAR.S, VARA, and VARPA functions have similarities, there are important factors to consider regarding which one to use.
First and most importantly, the size of your data set. An important distinction in Excel when calculating variance is whether the data set is a population or a sample.
Population refers to the entire data set or group, while sample refers to a subset or a specific group within the population. Remember that the sample size is always lesser than the population size. For instance, the entire class is a population, and the female students in the class are a sample.
We can choose between the VAR.S function and the VARA function to calculate sample variance. We have the VAR.P function and the VARPA function to calculate population variance.
The second thing to consider is whether the data set is purely numerical or contains text or logical tests. If the data set is purely numerical, we can choose between VAR.S and VAR.P. If the data set contains text or logical tests, we have VARA and VARPA.
VARA and VARPA support text and logical tests by converting them to the numerical equivalent. So a text is considered as 0 while logical values are considered 0 for false and 1 for true.
These factors are very important things to consider because Excel calculates variance differently depending on the size of the data set. To make this decision easier, refer to the table below that summarizes all these factors.
| Variance function | Size of the data set | Data type |
| VAR.S | sample | numerical only |
| VARA | sample | text and logical tests |
| VAR.P | population | numerical only |
| VARPA | population | text and logical tests |
The Anatomy of the VAR.S Function
The syntax or the way we write the VAR.S function is as follows:
=VAR.S(number1; [number2];...)
Let’s dissect this formula and understand each term:
- = the equal sign is how we start any function in Excel
- VAR.S() this is our
VAR.Sfunction. This function calculates the sample variance. It only supports numerical data. - number1 is a required argument. This is a single value or can be a reference to the range of the data set.
- number2 is an optional argument. If we want to input each value separately, Excel’s limit is 254 different values. We can simply input a cell reference of a range if the data exceeds 254.
Note: The syntax of the VARA function is the same, but it supports text and logical tests.
The Anatomy of the VAR.P Function
The syntax or the way we write the VAR.P function is as follows:
=VAR.P(number1; [number2];...)
Let’s take each term and understand what they mean:
- = refers to the equal sign, which is how we start any function in Excel.
- VAR.P() is the
VAR.Pfunction. It calculates the population variance. - number1 refers to a single value or a cell reference for a range. It is a required argument.
- number2 is an optional argument.
Note: The syntax of the VARPA function is the same, but it supports text and logical tests.
We have learned the structure of the variance functions. Now let’s move on to examples of calculating the variance in Excel.
A Real Example of Calculating Variance in Excel
Let’s take a sample data set containing the exam results of a class. To find out how well they performed on the exam as a whole, we will calculate the variance using the four different functions. Let’s check what our data set looks like.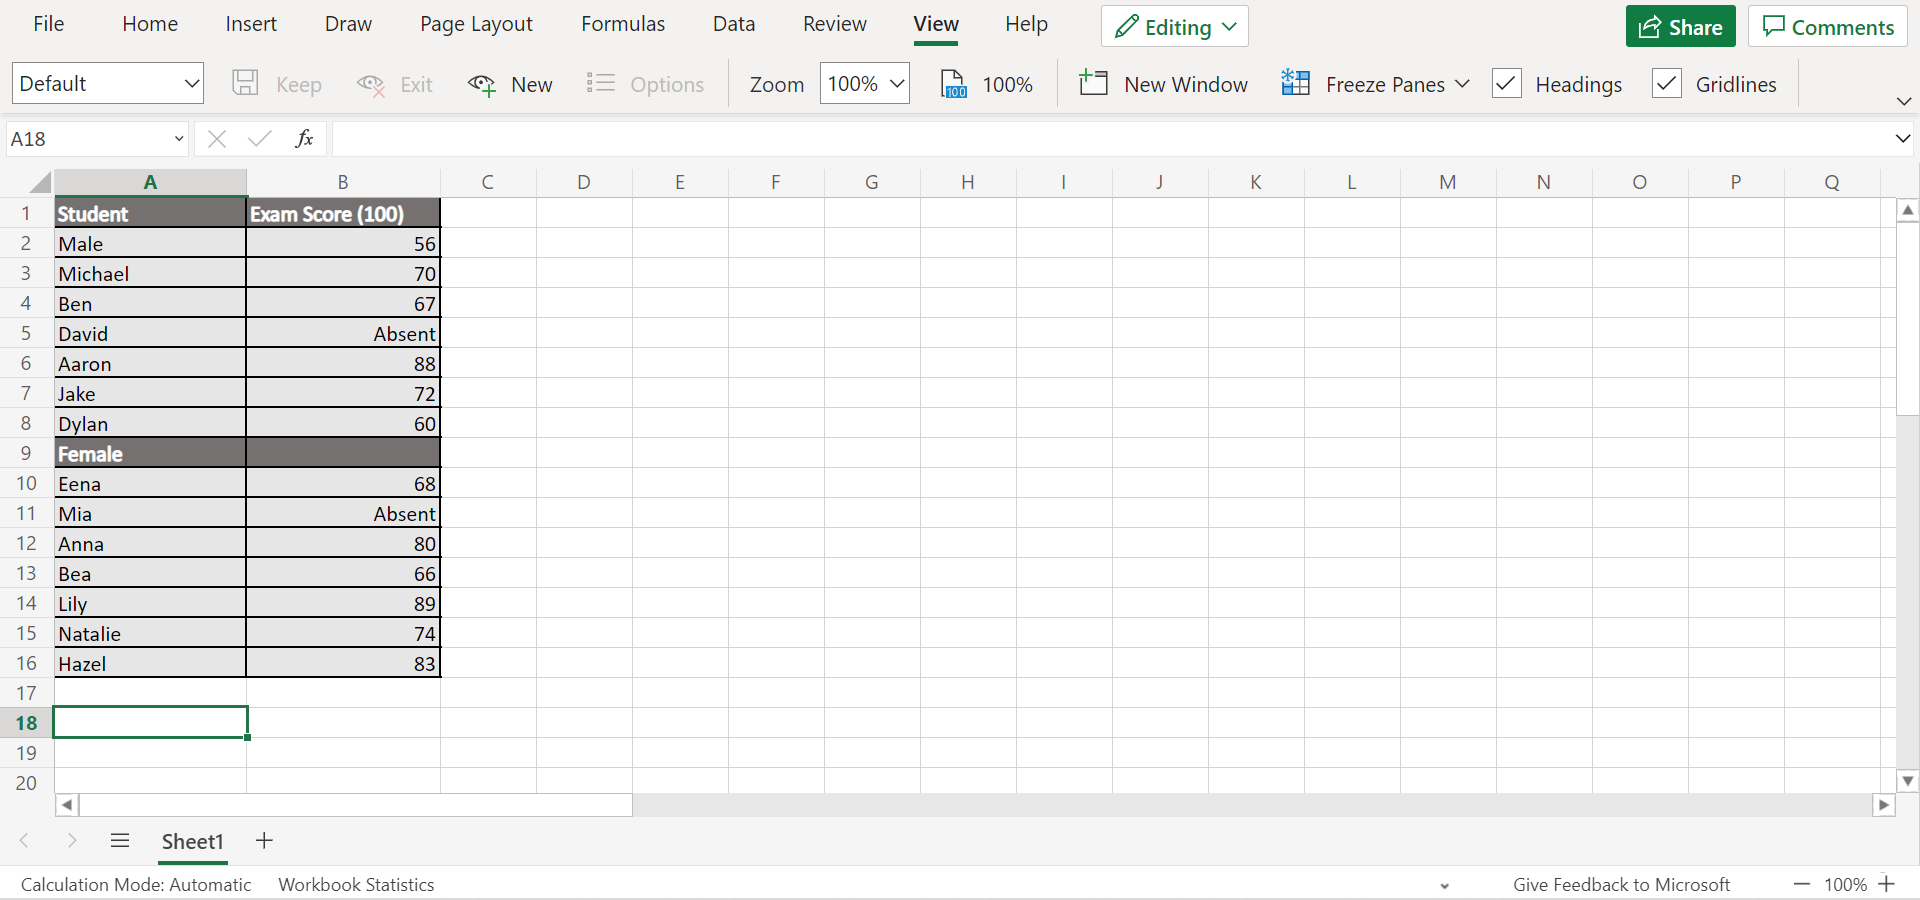
Let’s try using all the four variance functions to see how the results will differ. When choosing which appropriate function to use, consider all the factors to get the correct results.
If we want to calculate the variance of the entire class and ignore any text or logical tests, we can use the VAR.P function. Otherwise, we can use the VARPA function if we want to include the text or logical results of the population in the overall result.
If we want to calculate the variance of only the female students, which makes it a sample, and ignore any text or logical tests, we can utilize the VAR.S function. Otherwise, we can utilize the VARA function if we want the text or logical test to count in the overall results of the variance sample.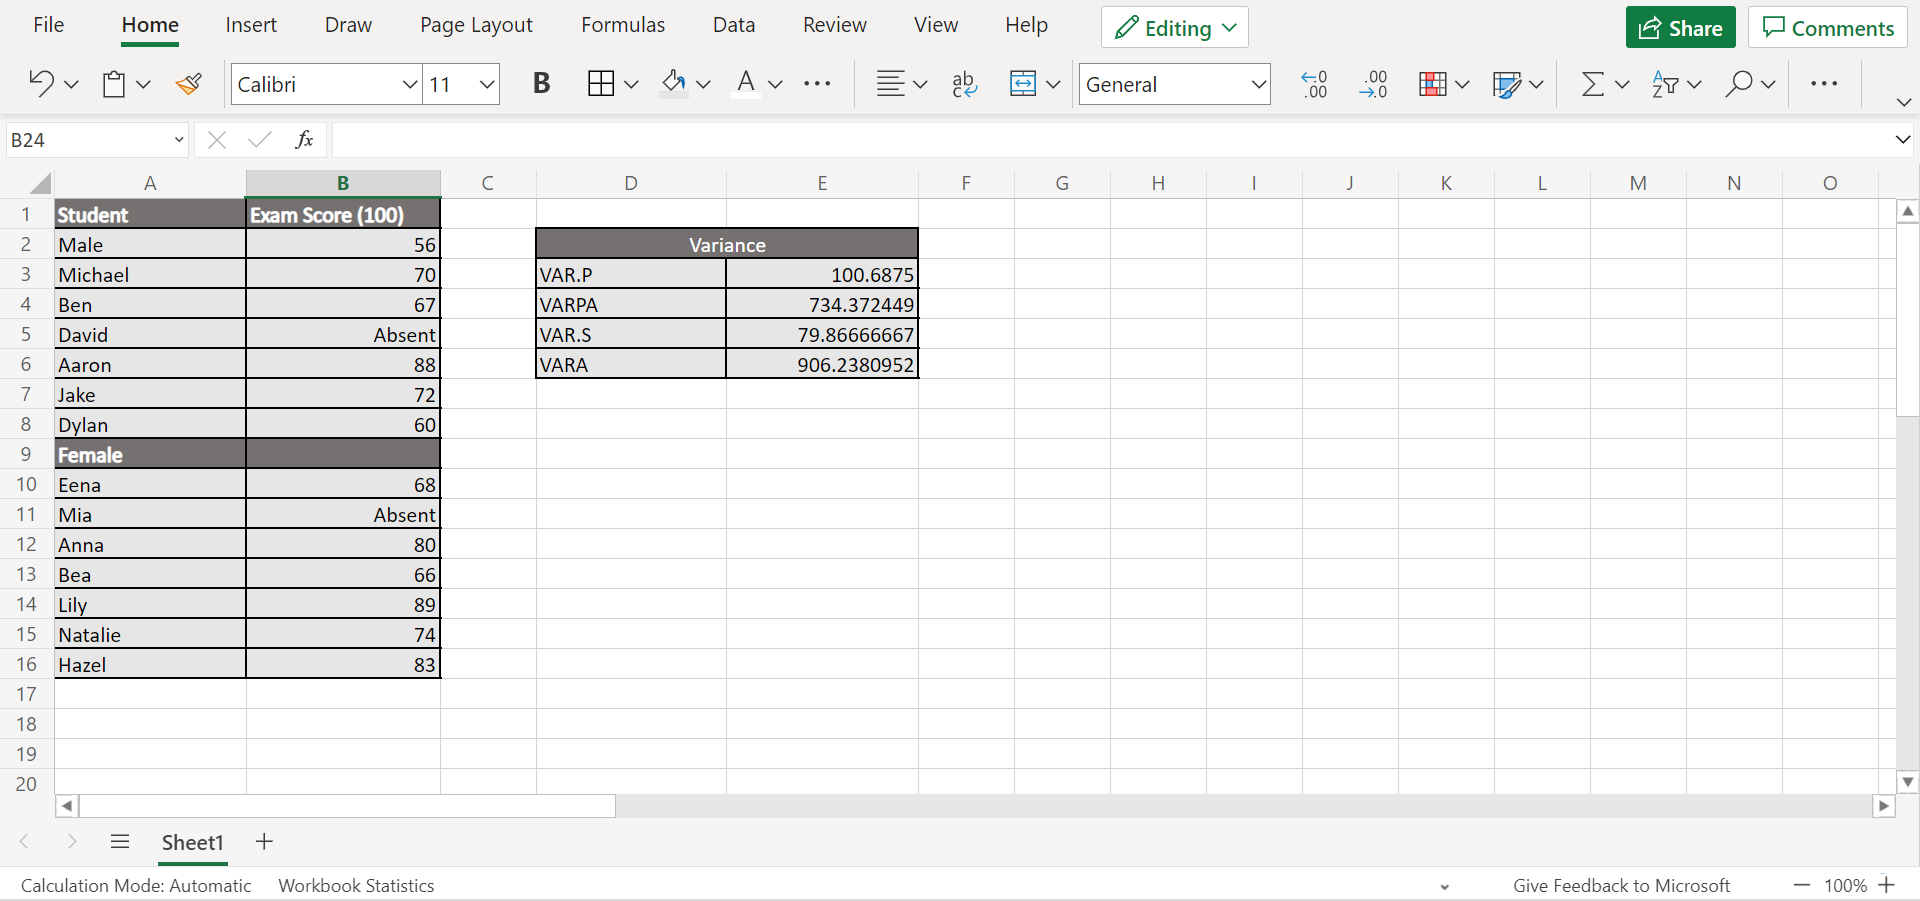
You can make your own copy of the spreadsheet above using the link attached below.
How to Calculate Variance in Excel
This section will explain the step-by-step process of calculating variance in Excel using VAR.S, VARA, VAR.P, and VARPA.
1. First, let’s calculate the population variance using the VAR.P function. Type in =VAR.P to start the function. Then, select the cell range containing the exam results. So the entire formula will be =VAR.P(B2:B16). Press enter to return the result. 
2. Second, let’s calculate the same population, but this time let’s include the text in the result. Similarly, type in the formula =VARPA(B2:B16). Then, press the Enter key to show the variance.
3. Next, let’s get the sample variance using the VAR.S function. For instance, we only want to calculate the exam results of the female students. Input in the formula =VAR.S(B10:B16). Finally, press the Enter key to return the result.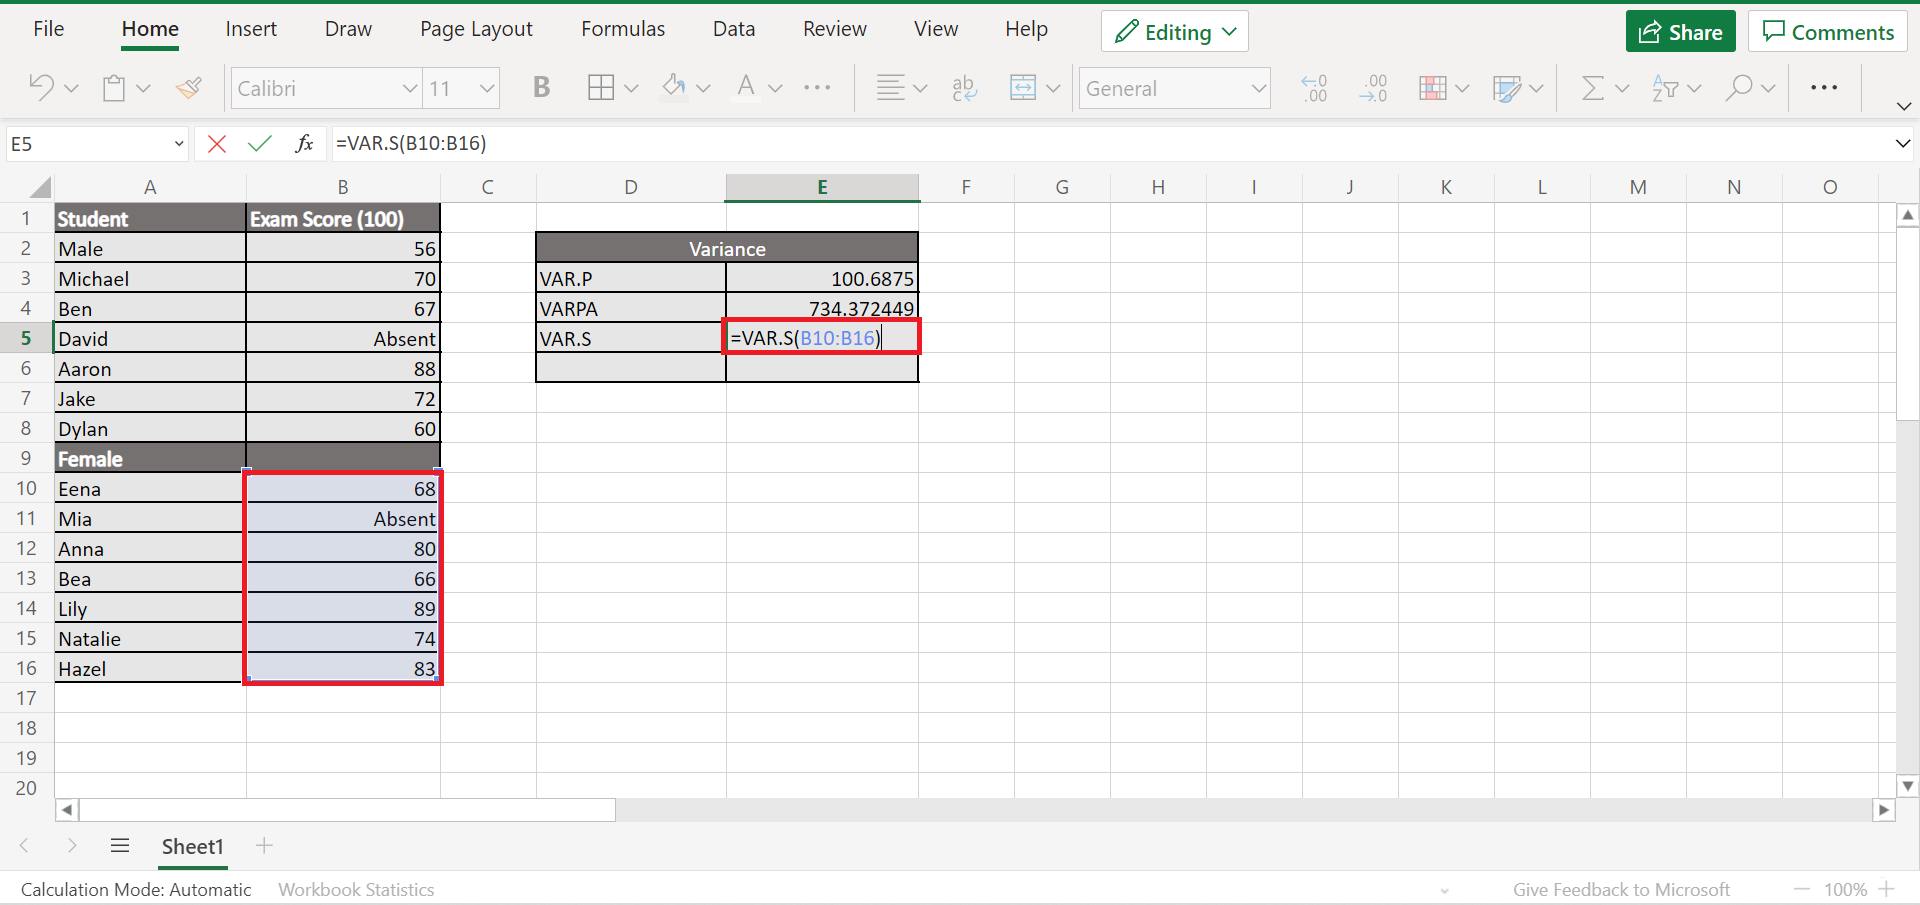
4. Similarly, let’s count the text or logical tests in calculating the sample variance using the VARA function. Type in the formula =VARA(B10:B16), which only refers to the exam results of the female students. Lastly, press enter.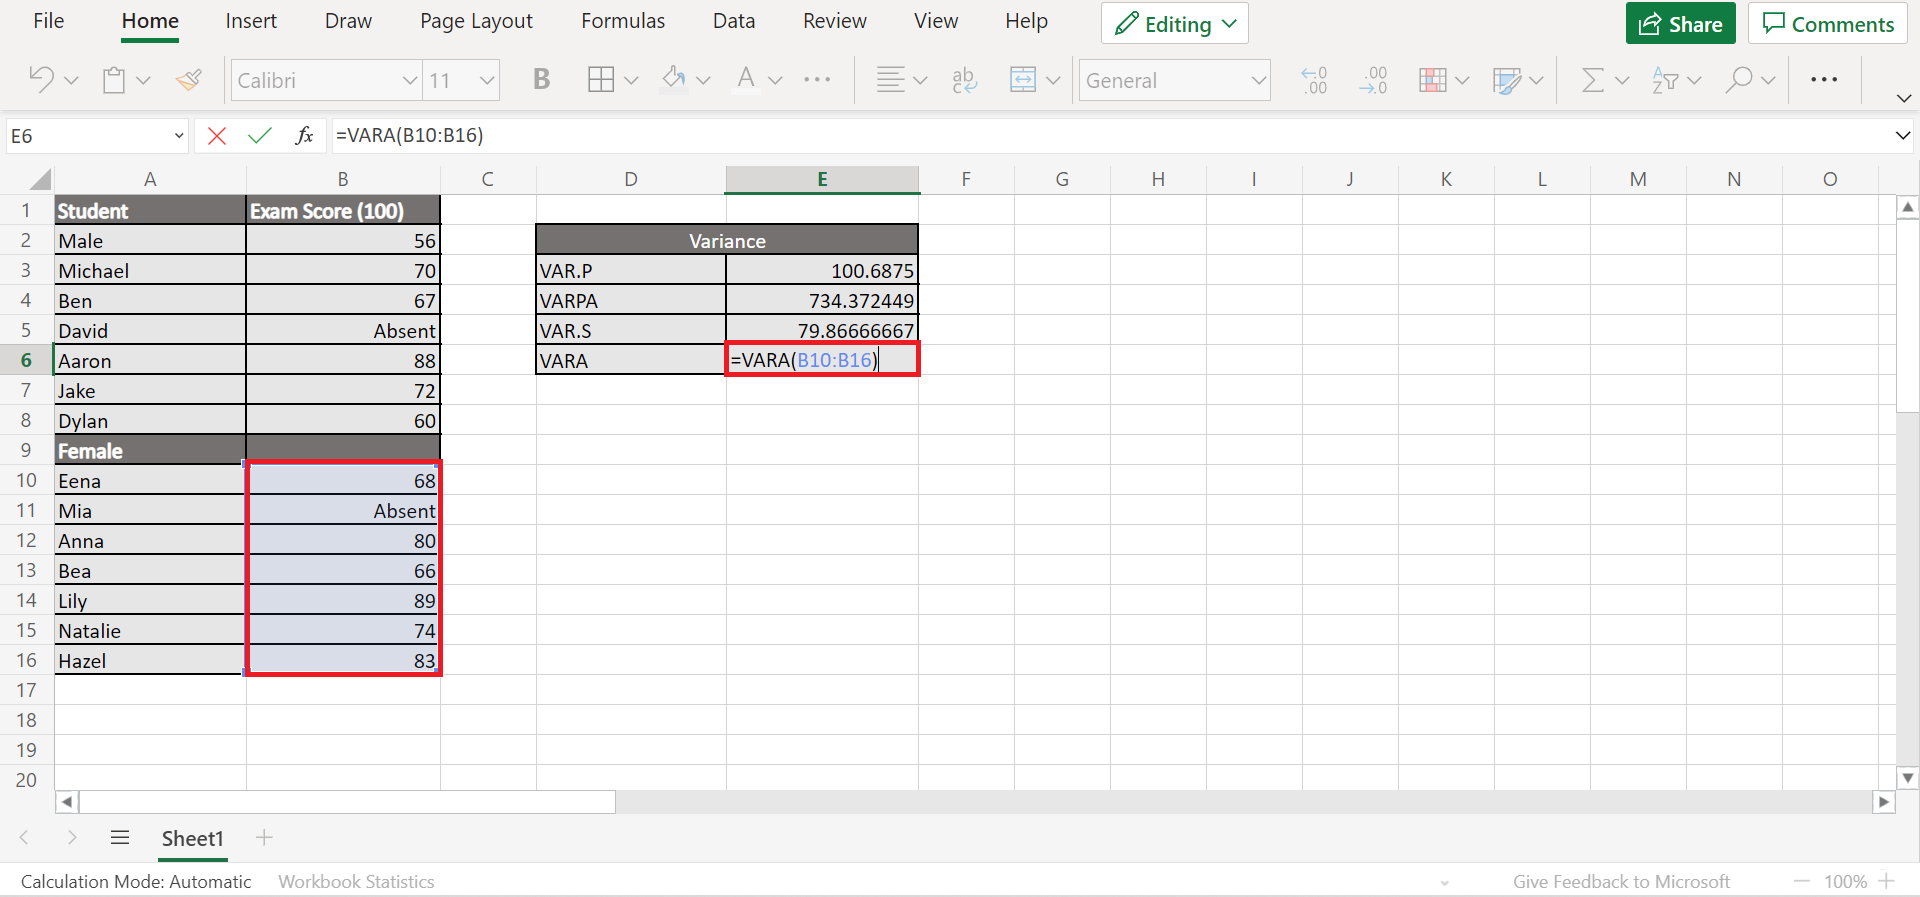
5. And tada! We have successfully calculated the variance using the different variance functions in Excel.
Great! That’s pretty much it. You have learned how to calculate variance in Excel using VAR.S, VARA, VAR.P, and VARPA.
Are you interested in learning more about what Excel can do? You can now use the VAR.S, VARA, VAR.P, and VARPA functions in Excel and the various other Microsoft Excel formulas available to create great worksheets that work for you. Make sure to subscribe to our newsletter to be the first to know about the latest guides and tutorials from us.