


Learning how to generate charts automatically is useful when you need to create a visualization of your data.
Compared to tabulated data, charts can offer more insight for the user. Charts are also more intuitive for understanding, especially if there is an abundance of data in your dataset.
Let’s take a look at a few examples of how charts can help improve your Google Sheet.
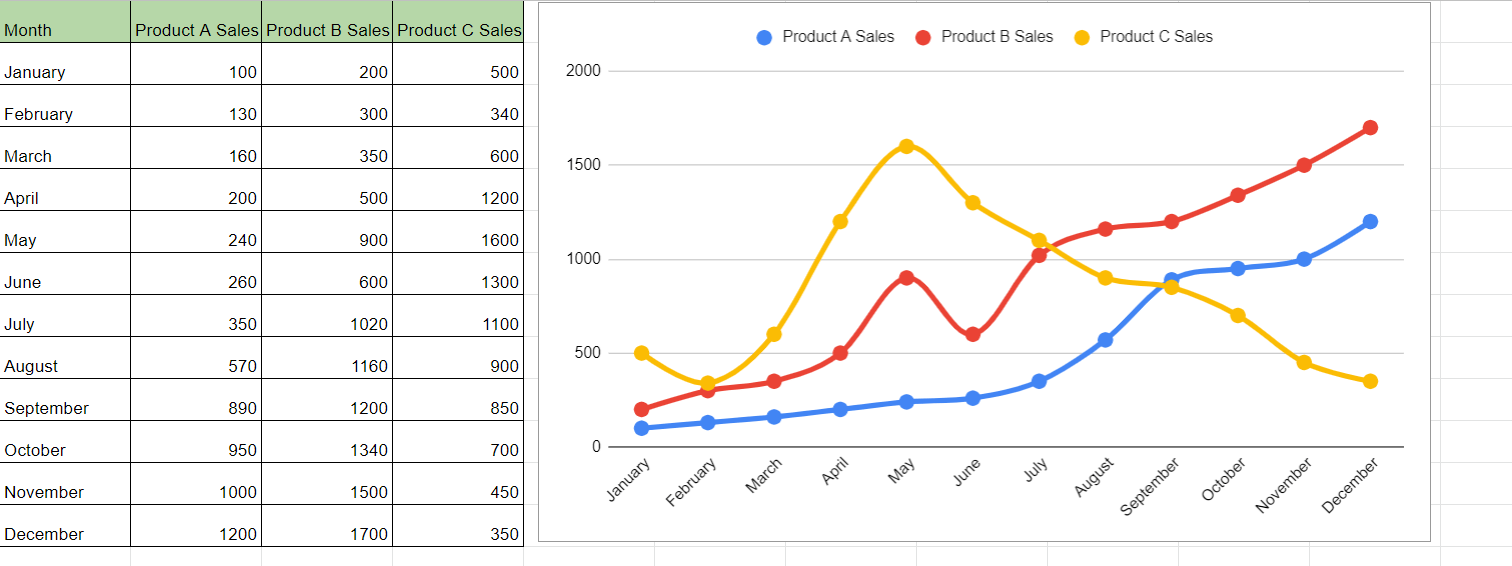
As an owner of an online shop, you’ve started looking into the previous year’s sales. You hope to find trends in the data to help make business decisions for the next product. We have a table of monthly sales for three of our main products.
Using a bar or column chart, we can compare the total annual sales of each product. A pie chart can give you how much of a percentage each product contributes to total sales. Monthly data allows us to create a line chart to show how much the sales fluctuate over time.
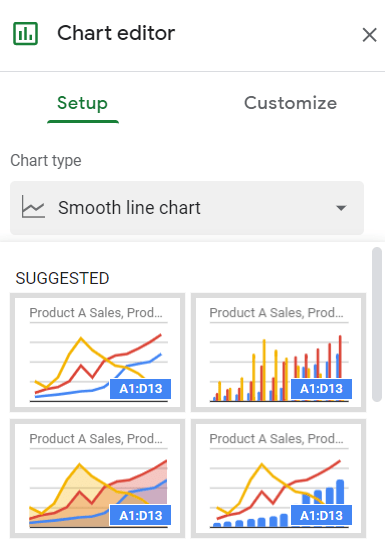
Google Sheets makes it really easy to explore different chart options for your data. The Chart editor even provides chart suggestions based on the data selected.
For example, when using a dataset with a time series, Google Sheets suggests inserting a line chart over something like a pie or column chart.
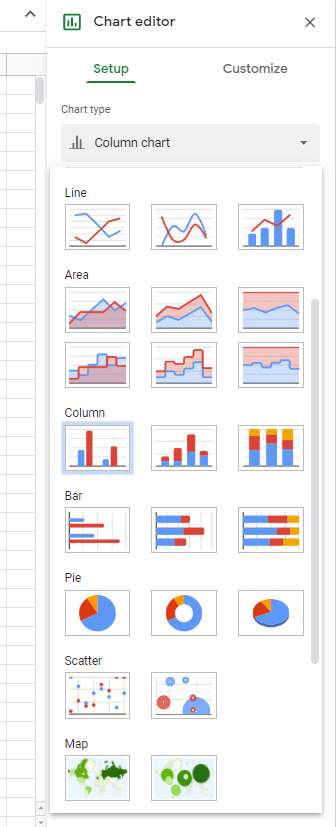
The main categories for charts are the following: line, area, column, bar, pie, scatter, map, and others.
Another useful feature of Google Sheets is that it automatically updates the chart whenever changes are made to the dataset. We can use this feature to our advantage by creating dynamic and interactive charts.
Let’s learn how to automatically generate charts in Google Sheets and test our skills with actual datasets.
A Real Example of Automatically Generating Charts
Let’s look at a real example of automatically generating charts in a Google Sheets spreadsheet.
We created a line chart out of our monthly sales data in the example below. The line chart makes it easier to identify trends in our data. Anyone can easily see that Product C peaked in May and is slowly losing interest. Meanwhile, both Product A and B are steadily rising throughout the year.
Alternatively, we can use a 100% stacked area chart to compare the share of sales per month. This second chart highlights the domination of Product C earlier in the year and how it’s slowly been replaced with other products by December.

If we’re dealing with categorical data, then it might make sense to use a bar chart or a pie chart. The latter is more appropriate for values that are part of a whole. In the example below, we used a doughnut chart, which is a variation of a pie chart.

You can make a copy of the spreadsheet above using the link attached below.
In the next section, we’ll look into how to set up Google Sheets charts in your spreadsheet.
How to Automatically Generate Charts in Google Sheets
This section will go through each step needed to automatically generate charts in Google Sheets. This guide will show you how to create an appropriate visualization from a dataset.
Follow these simple steps to start using the Chart feature:
- First, identify the dataset you’ll be converting into a chart. Determine whether the data fits best with a line chart, pie chart, bar chart, or other visualization.
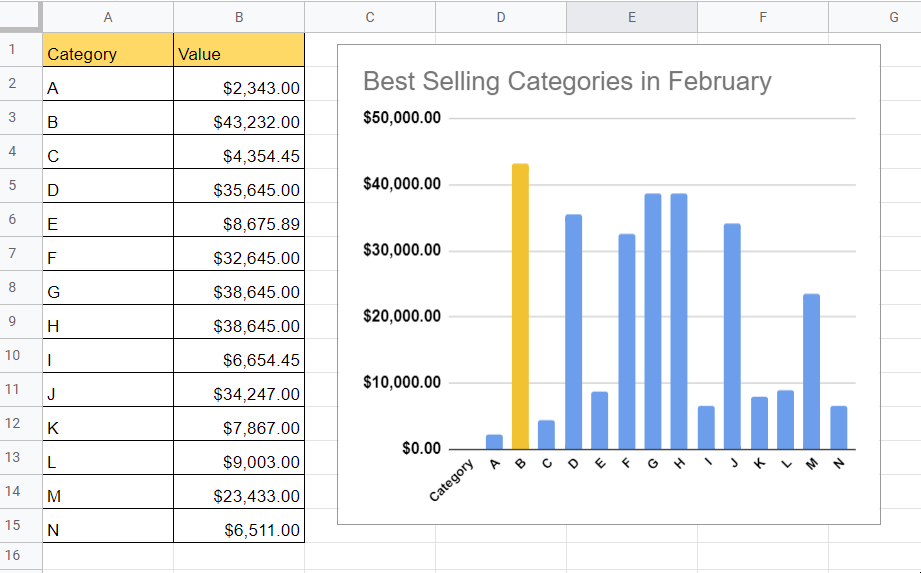
 In this example, we simply want to compare the dollar value of each category. A bar or column graph would be best for this purpose.
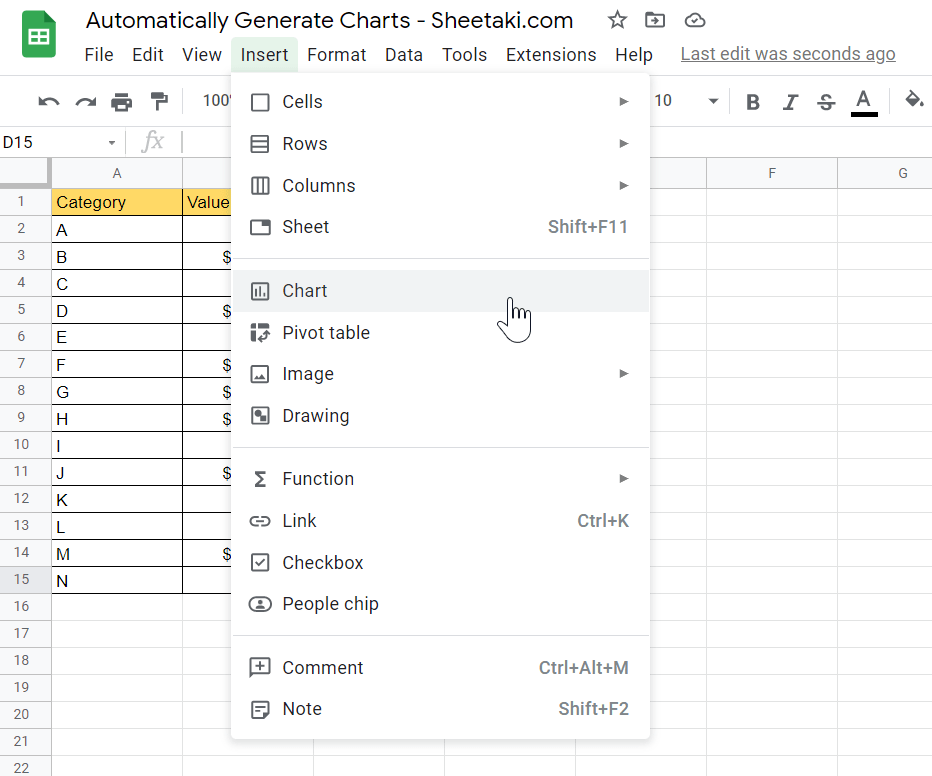
 - Next, we can add a chart by selecting the Chart option under the Insert menu.
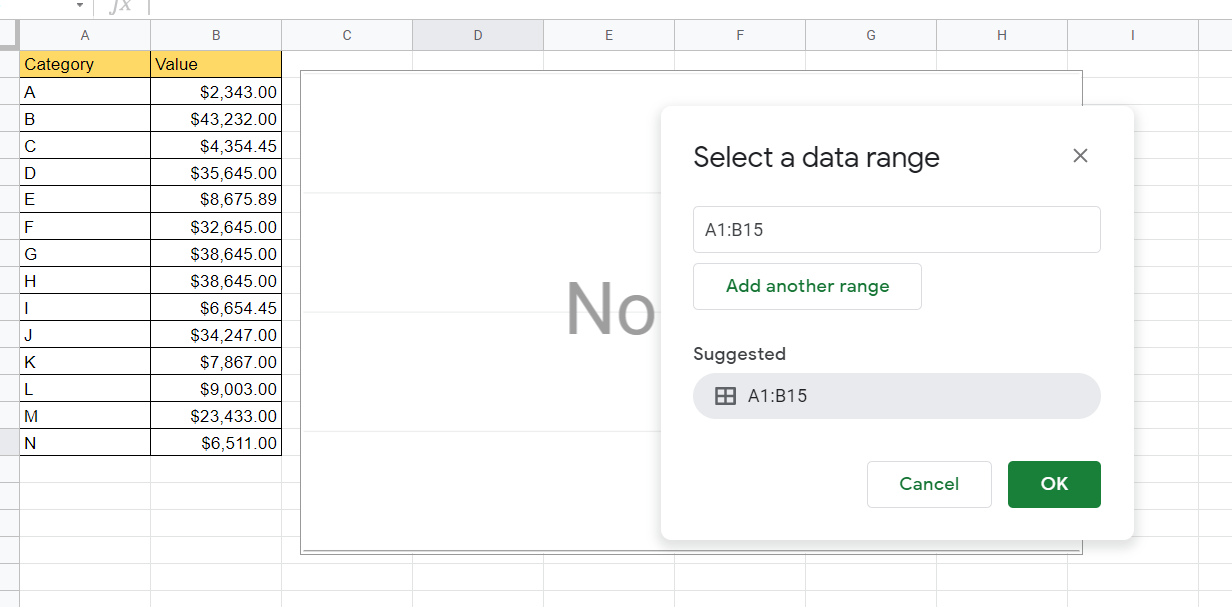
- You will find a blank box has been inserted into your spreadsheet. You may drag and resize this box as needed. You’ll need to adjust options in the Chart editor that can be found on the right-hand side of your screen.

- You can specify which range to pull the data from in the Data Range option.
- In the Chart editor, we can select which chart type to create. For this example, we’ll select the regular column chart.
- Your chart should now look something like this:

- The Chart editor also allows you to change the formatting options of your chart. Simply head over to the Customize tab to change the format of your visualization. You can give your chart a title, highlight specific data points, and adjust the font and color of your labels.
Frequently Asked Questions (FAQ)
- How do I download a chart made in Google Sheets?
Click on the options icon found on the top-right corner of your chart. You have the option to download the chart as a PNG image, PDF document, or as a Scalable Vector Graphics file (SVG).

- Is it possible to share an interactive version of a Google Sheets chart?
You have the option to publish a chart. Published charts can be shared publicly without giving access to the original spreadsheet. You have the option to share it as an image or to keep it as an interactive chart.

This step-by-step tutorial guide shows how simple it is to generate charts in Google Sheets automatically.
You can now use these charts in Google Sheets together with the various other Google Sheets features available to create great worksheets that work for you.
Are you interested in learning more about what Google Sheets can do? Make sure to subscribe to our newsletter to be the first to know about the latest guides and tutorials from us.


