

This guide will explain how you can calculate the cumulative percentage in Excel.
In mathematics, the cumulative percentage is the running total of the percentage values of a certain set of responses.
In Excel, we can calculate the percentage of a value against a total value by simply dividing our value by the total. For example, we know that 500 is 20% of 2,500 because 500/2500 = 0.2 = 20%.
What happens if we have multiple values that you want to group together and compare against a total value? Let’s say we have 10 values, and we want to know what percentage of the first five values make up the total. This example will require you to look for the cumulative percentage.
Let’s take a look at a quick example where we’ll need to solve for a cumulative percentage.
Suppose you have a table of monthly sales for the year 2022. The task is to determine how much of our total sales were earned by the first quarter, second quarter, and so on. We can use cumulative percentages to figure this out.
We simply need to create a running total of the amount of sales from January to the current month. For example, the running total for October should include all sales from January to October. After retrieving this running total, we simply divide this value by the total number of sales in that year.
This use case is just one way to use cumulative percentages in Excel. The use of cumulative percentages can help keep track of growth. It is an important calculation in statistics because it can show how a particular quantity changes over a specific period of time.
Now that we know when to use cumulative percentages, let’s see how you can use these principles in practice on a spreadsheet. We will also go over the formulas used in our sample sheet.
A Real Example of Calculating Cumulative Percentage in Excel
Let’s take a look at a real example of a spreadsheet that keeps track of the cumulative percentage of a quantity.
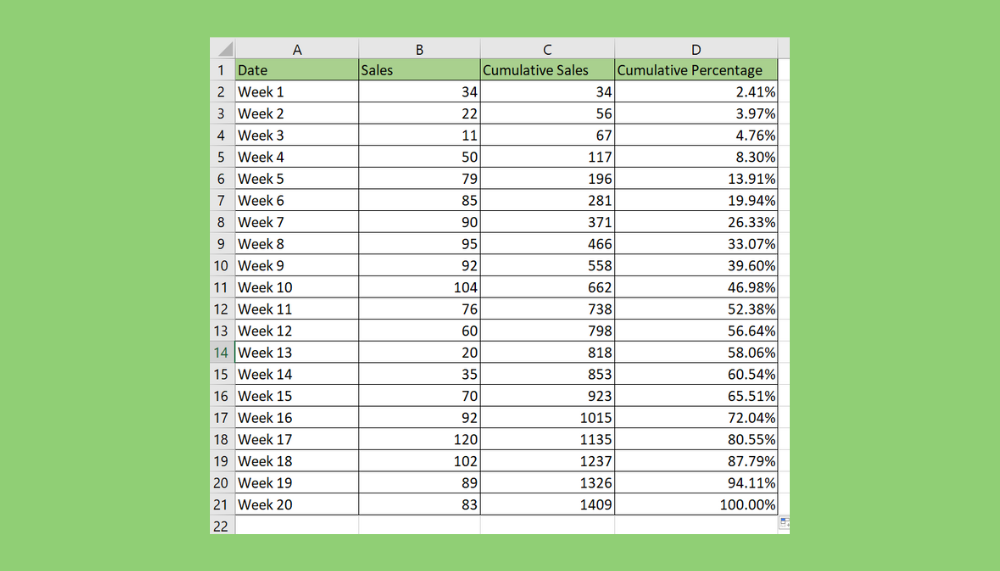
In the example below, we have a table with weekly sales data. Column C calculates a running total of the sales since Week 1, and Column D computes the cumulative percentage of the sales so far.

To get the values in Column C, we just need to use the following formula:
=SUM($B$2:B2)
The beginning of the range is written as an absolute reference so that we can calculate the running total as we fill out the rest of the sheet.
To calculate the values in Column D, we can use this formula:
=C2/$C$21
In the formula above, we simply divide that week’s running total by the total number of sales.
We’ve combined these two columns in the example below to create a more concise formula.
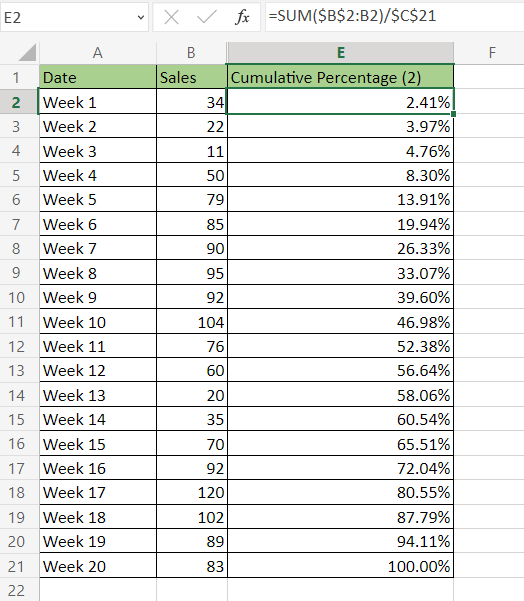
To get the values in column E, we can use the following formula:
=SUM($B$2:B2)/$C$21
You can make your own copy of the spreadsheet above using the link attached below.
If you’re ready to try out cumulative percentages in Excel, let’s begin writing it ourselves!
How to Calculate Cumulative Percentage in Excel
This section will guide you through each step needed to compute cumulative percentages in Excel. You’ll learn how we can set up a running total that we can then use to find the cumulative percentage.
In this example, we’ll be using cumulative percentages to determine which week the vendor achieved 50% of all sales.
Follow these steps to calculate the cumulative percentage in Excel:
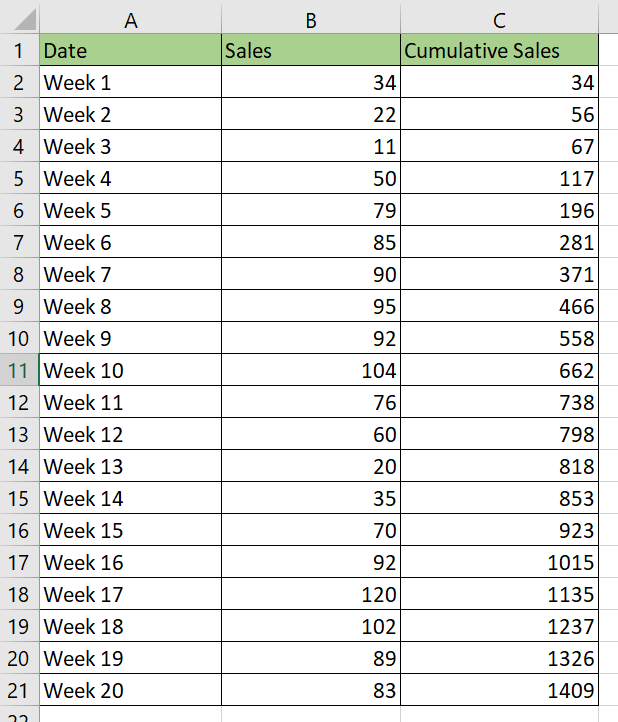
- First, we must create a new column that holds the running total of sales. In the example below, we’ve added a new column labeled Cumulative Sales.

- Next, use the SUM function to get the total of all sales from the first week to the current week. Since we’re starting with the first week, we’ll use the range $B$2:B2.

- Drag down the formula to fill in the running total for all weeks. The final week’s running total is equivalent to the total number of sales in this specific time period of twenty weeks.
- Next, add another column labeled Cumulative Percentage. To calculate this, simply get the current week’s cumulative sales and divide it by the cumulative sales of the last week.

- To show the decimal as a percentage, select the cell and click on the percent symbol in Home > Number > Percentage.

- Drag down the formula to fill in the cumulative percentages of the rest of the cells. In the example below, we can now figure out that the vendor reached over 50% of sales on Week 11.
Frequently Asked Questions (FAQ)
- How can I get the percentage by time period only?
To get the percentage by time period, we can simply divide the amount associated with that time period by the total amount. Since we’re not looking for a running percentage, we do not need to use the running total as the numerator.
This step-by-step guide should be all you need to start calculating cumulative percentages yourself in Excel. Our guide shows how easy it is to determine when a particular value reaches a certain running percentage.
Cumulative percentages are just one example of a statistical computation you can solve in Excel. With so many other Excel functions available, you can surely find one that suits your use case.
Are you interested in learning more about what Excel can do? Subscribe to our newsletter to learn about our latest Excel guides and tutorials.


