This guide will explain how to calculate skewness in Excel.
Skewness is a measure of symmetry that statisticians use to describe the shape of a particular distribution.
In statistics, skewness typically refers to the asymmetricity of a distribution around a mean.
A normal curve would represent a symmetrical distribution. Values cluster close to the mean and taper off the further away you are from the mean. This type of distribution is common in many phenomena.

Height in a population, for example, tends to follow a normal distribution where most people generally have a similar height with a few outliers of extremely short and extremely tall individuals.
However, not all distributions follow a normal distribution. The presence of more extreme values can pull the distribution towards the right or left.
How much the distribution is pulled on either side is known as skewness. A positive skew occurs when the right tail of the curve is longer than the left. A negative skew would be when the left tail of the curve is longer.
Let’s take a look at a quick example of a skewed dataset.
Suppose you draw a curve to represent the distribution of average household incomes. Most households will fall near the mean average household income. However, a select few wealthy households will skew the distribution to have a longer tail to the right of the mean.

In the example above, the distribution is positively skewed. We can calculate the skewness using the following formula:
In Excel, we can calculate skewness easily by passing a range through the SKEW function. Excel calculates the skewness value using the following formula:

In the formula above, Xi refers to the ith random variable. The x̄ variable refers to the mean of the distribution, n is the number of variables, and s is the standard distribution.
Now that we know the definition of the skewness function, let’s learn how to find it on an actual Excel spreadsheet.
A Real Example of Calculating Skewness in Excel
The following section provides a few examples of how to calculate skewness in Excel. We will also explain the formulas and tools used in these examples.
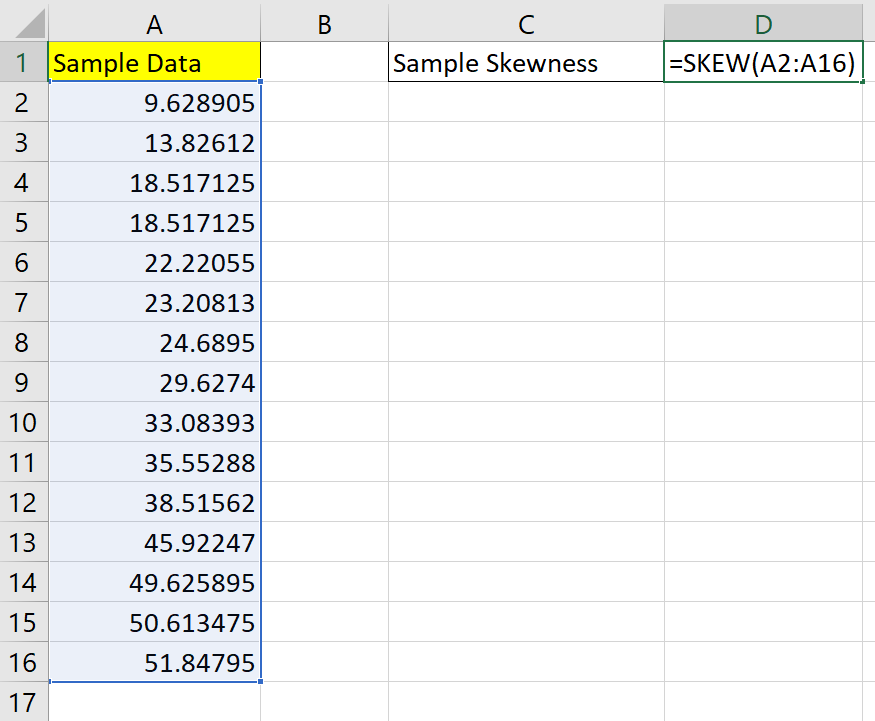
Given a dataset of 15 values, we want to determine the skewness of the sample distribution.

The easiest way to find the skewness of a sample distribution is through the SKEW function.

To get the values in Column C, we just need to use the following formula:
=SKEW(A2:A16)
We can also find the skewness value through the Analysis Toolpak add-in. The add-in includes a tool called Descriptive Statistics that returns several values that describe a specified dataset.

Do you want to take a closer look at our examples? You can make your own copy of the spreadsheet above using the link attached below.
Use our sample spreadsheet to take a closer look at both methods you can use to calculate skewness.
If you’re ready to try calculating skewness yourself, head over to the next section to read our step-by-step breakdown on how to do it!
How to Use Calculate Skewness in Excel
This section will guide you through each step needed to start calculating the skewness of sample data in Excel. You’ll learn how to use the SKEW function and the Analysis Toolpak add-in to determine the skewness of a dataset.
Follow these steps to calculate skewness:
- First, we’ll try using the
SKEWfunction to find the sample skewness from our data.
Select an empty cell where you want to place the sample skewness value.

- Next, type the formula ‘=SKEW(‘ to begin the
SKEWfunction.

- The
SKEWfunction accepts a cell range containing the dataset you want to describe.

- Hit the Enter key to evaluate the
SKEWfunction.
In this example, we’ve determined that the skewness of our sample data is 0.2.

- Next, we’ll try calculating skewness using the Analysis Toolpak add-in in Excel.
If you have not yet enabled the Analysis Toolpak, you must activate the add-in through the Excel Options dialog. Navigate to the File tab to find the Options menu.

- Click on the Options button on the lower-left corner of the File tab.

- In the Excel Options dialog box, click on the Add-ins tab and select Go.

- Ensure that the Analysis Toolpak option is checked, then click on OK.

- In the Data tab, click on the Data Analysis option

- Select the Descriptive Statistics option and click on OK.

- Type the cell range containing your dataset as the input range. Specify an output range for the table of descriptive statistics. Check the option labeled ‘Summary Statistics’. Click on OK to proceed.

- A new table should appear, showing several key statistics about the selected data. One of these values should be labeled ‘Skewness’.

These are all the steps needed to calculate skewness in Excel.
Frequently Asked Questions (FAQ)
Here are some frequently asked questions about skewness:
- What is the difference between skewness and kurtosis?
Skewness and kurtosis are both useful values that give statisticians insight into the shape of a particular distribution. Skewness measures the symmetry of a distribution and kurtosis measures how heavy or light the tails are on either side of the distribution.
This step-by-step guide should provide you with all the information you need to start calculating the skewness of a sample population.
You should now have a clearer understanding of the importance of the skewness statistic and how to easily calculate it in Excel.
The SKEW function is just one example of the many Excel functions you can use in your spreadsheets. Our website offers hundreds of other functions and methods to help you get more out of Microsoft Excel.
With so many other Excel functions available, you can find one appropriate for your use case.
Don’t miss out on our team’s new spreadsheet tips, tricks, and best practices. Subscribe to our newsletter to stay updated on the latest guides from us!


