This guide will explain how to perform logistic regression in Excel.
We’ll explain how to use the maximum likelihood estimation method and the Solver add-in to find the coefficients of our regression model.
Logistic regression is a type of predictive analysis that explains the relationship between a dependent binary variable and one or more independent variables.
With logistic regression, we can create a working regression model in an Excel spreadsheet.
Let’s take a look at a simple example of a situation where we can perform logistic regression in Excel.
Suppose you want to predict whether a customer will purchase a particular product.
The dependent variable in this scenario is either 1 or 0. Either the customer will purchase a product (1), or they will not order anything (0). The independent variables in this scenario could be the potential customer’s age, gender, or even the time and date they visited the store.
Given the training data of 1000 customers, how can we perform logistic regression in Excel?
To create the regression model for this scenario, we’ll need to find the regression coefficients. In this guide, we’ll use the maximum likelihood estimation method to estimate these coefficients.
Now that we know when to perform logistic regression, let’s learn how to set it up on an actual sample spreadsheet.
A Real Example of Performing Logistic Regression
The following section provides an example of how to perform logistic regression in Excel. We will also explain the formulas and tools used in these examples.
First, let’s take a look at our sample data. Our table includes customer information such as their age, how many days since they first visited the store website, and the number of items in their cart. The first column is the dependent variable that indicates whether the customer purchased on their latest visit.

We can perform logistic regression by using the maximum likelihood estimation method.

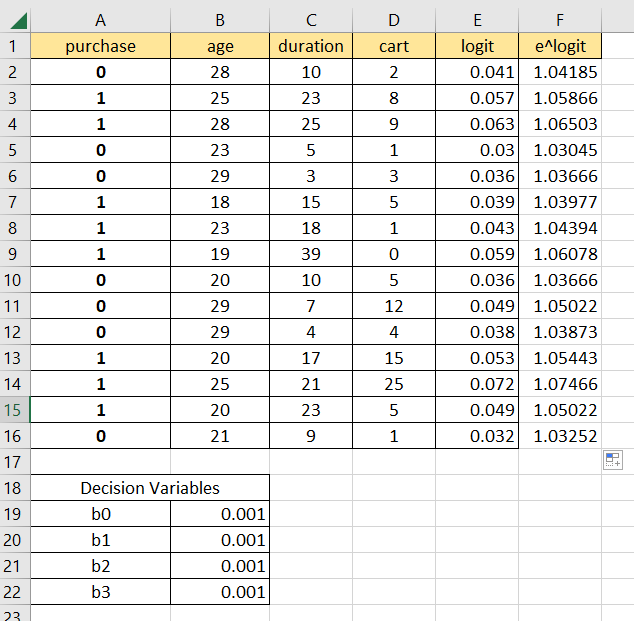
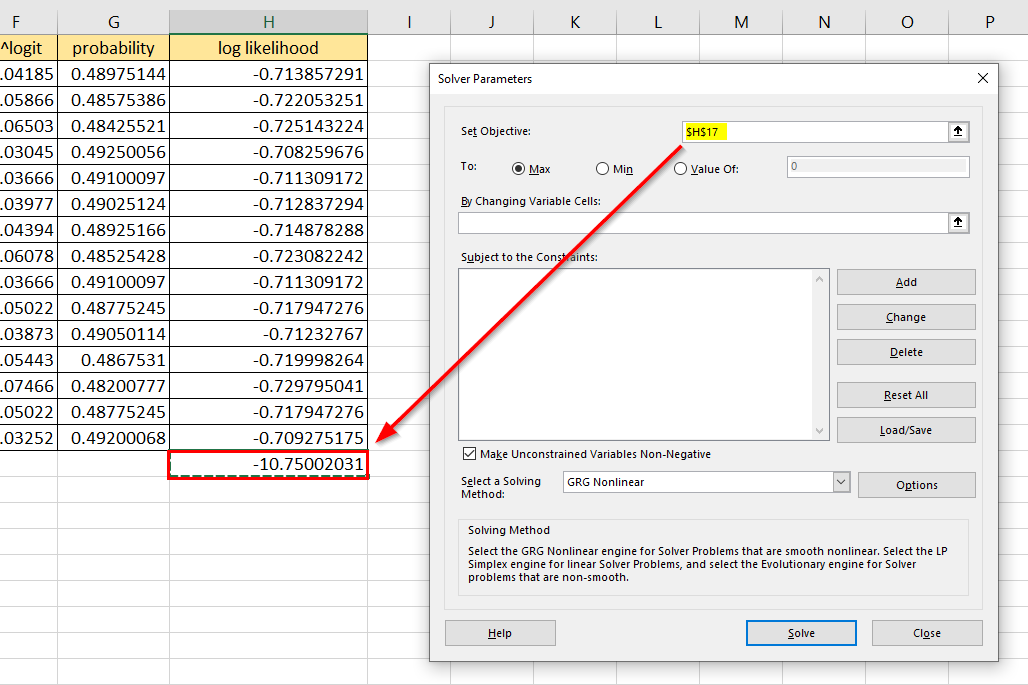
To get the coefficients seen in the bottom-left table, we used the Solver tool to maximize the value in cell H17 by changing the four coefficients.
Do you want to take a closer look at our examples? You can make your own copy of the spreadsheet above using the link attached below.
If you’re ready to try performing logistic regression, head over to the next section to read our step-by-step breakdown on how to do it!
How to Perform Logistic Regression in Excel
This section will guide you through each step needed to perform logistic regression in Excel. You’ll learn how to find the regression coefficients using the Solver tool.
Follow these steps to perform logistic regression in Excel:
- First, create a new table with entries for each decision variable. Each variable will have a placeholder coefficient.
 In this example, we’ll start with a placeholder value of 0.001.
 - Next, we’ll create a new column labeled ‘logit’.

- We’ll use the Fill Handle tool to fill out the rest of the logit column.

- Next, we’ll create another column to compute for e^logit.
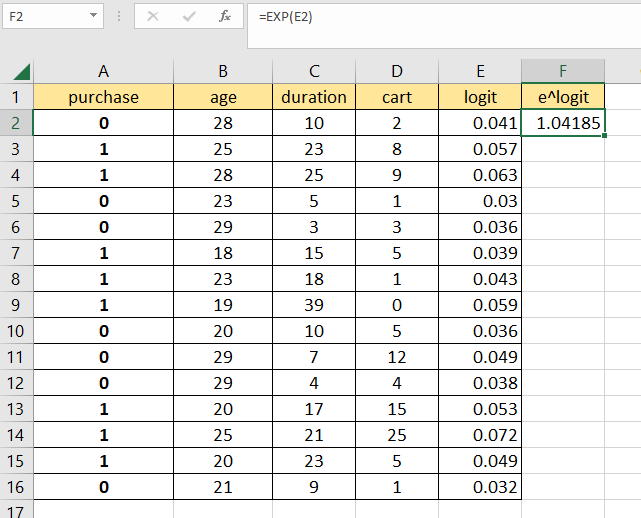
- We’ll use the Fill Handle again to fill out the rest of the column.
- Next, we’ll use the formula
=F2/(1+F2)to find the probability of each data point.

- We’ll use an Excel formula to calculate the log-likelihood of each probability.

- We’ll use the
SUMfunction to find the total of all log-likelihood values.

- Next, we’ll click on the File tab.

- In the File menu, select the Options button.

- In the Excel Options dialog box, click on the Add-ins tab. Select the Go.. option.

- Ensure that the Solver Add-in option is checked. Click on OK to proceed.

- In the Data tab, click on the Data Analysis option. In the Set Objective textbox, input the cell that computes the total of all log-likelihood values. Our goal is to maximize this value.
- Next, select the placeholder values as the range to change.

- Ensure that the ‘Make Unconstrained Variables Non-Negative’ is unselected. Select the GRG Nonlinear option as the solving method. Click on Solve to proceed.

- The Solver add-in should now compute for the regression coefficients to use for logistic regression.
These are all the steps needed to perform logistic regression in Excel.
Frequently Asked Questions (FAQ)
Here are some frequently asked questions about performing logistic regression in Excel.
- What is the log-likelihood value?
The log-likelihood value in a regression model measures the goodness of fit of a model. A higher log-likelihood value indicates a better fit. We compute for the log-likelihood by finding the natural logarithm of the computed probability given certain parameters.
This step-by-step guide should provide you with all the information you need to begin performing logistic regression in Excel.
We’ve touched on how the maximum likelihood estimation is used to find the regression coefficients for our model. Our guide also showed how to use the Solver add-in to find the optimal values for these coefficients.
Logistic regression is just one example of the many Excel functions you can use in your spreadsheets. Our website offers hundreds of other functions and methods to help you get more out of Microsoft Excel.
With so many other Excel functions available, you can find one appropriate for your use case.
Don’t miss out on our team’s new spreadsheet tips, tricks, and best practices. Subscribe to our newsletter to stay updated on the latest guides from us!