The DSTDEV function in Google Sheets is useful if you need to calculate the standard deviation of a population based on a sample by using the numbers in a field (column) of records in a list or database that match conditions that you specify.
The DSTDEV function is a built-in function that is categorized as a ‘Database Function’. It can be used as a worksheet function, and can be entered as part of a formula in a cell of a worksheet.
Now, instead of a partial data (population sample), if you are working on full data (population), then there is another function called DSTDEVP that you may use. You can find a comprehensive guide on the same in one of our articles here.
What is a standard deviation?
For given data, the standard deviation is a measure of dispersion in statistics. “Dispersion” tells you how much your data is spread out. It demonstrates how much your data is spread out around the meaning or average. For example, are all your scores close to the average? Or are there lots of scores way above (or way below) the average score.
Let’s take an example.
Let us assume that I have gone to a dog rescue and adoption centre to adopt a “Pug”. The volunteer shows me data of the rescued pugs at their centre, and they have noted down each of their height and weight separately. I want to understand if pugs are generally of the same height for a given age, or if there is variation in how tall they grow up to be. Since I can not collect data for all the pugs in my country or region, I have to work with the limited sample of data collected at the centre.
Here is where the DSTDEV function comes to my aid. The function outputs the standard deviation of the heights for pugs at the adoption centre, which is a sample of the population of pugs in my country. The standard deviation of the heights is around 125.12mm for an average height of 294mm. Since the value is moderately high, I realize that heights for young pugs do vary and are not at the same level, in general.
That’s just one example. There are plenty of other use-cases for this function in real life. Great! Let’s dive right into such real-business use-cases, where we will deal with actual values and as well as learn how we can write our own DSTDEV function in Google Sheets to calculate variances in data.
The Anatomy of the DSTDEV Function
So the syntax (the way we write) of the DSTDEV function is as follows:
=DSTDEV(database, field, criteria)
Let’s dissect this thing and understand what each of the terms means:
=the equal sign is just how we start any function in Google Sheets.DSTDEV()is our DSTDEV function. DSTDEV will return the variance of an entire population selected from a database table-like array or range using a SQL-like query.- database refers to the array or range having the data, including headers for each column’s values
- field refers to the column in the data which has the values that are to be extracted and worked on.
- field may either be a text label referring to the required column header or a numeric value indicating which column to consider, where the first column has a value = 1.
- criteria refers to an array or range containing the criteria to filter the database values before operating. This may be left blank.
For a better understanding of the difference between estimating variance from a population vs. a sample, we shall be explaining the function using the same examples from our guide on DSTDEVP function, so that you can compare the two.
A Real Example of Using DSTDEV Function
Take a look at the example below to see how DSTDEV functions are used in Google Sheets.

The above are five of the many purchases Linda made at the grocery store this week. As is evident from the quantities purchased, she went a bit overboard with the third purchase listed down here. She wanted to know if her high-priced purchases were in the same price range as her low-priced purchases.
Just above the captured data, I have given a provision to enter the criteria based on which the data will be filtered. This is not a required criterion, and the function will still function properly if we leave it blank.
The DSTDEV function will give her the desired result based on the conditions specified in A2:D3, as below:
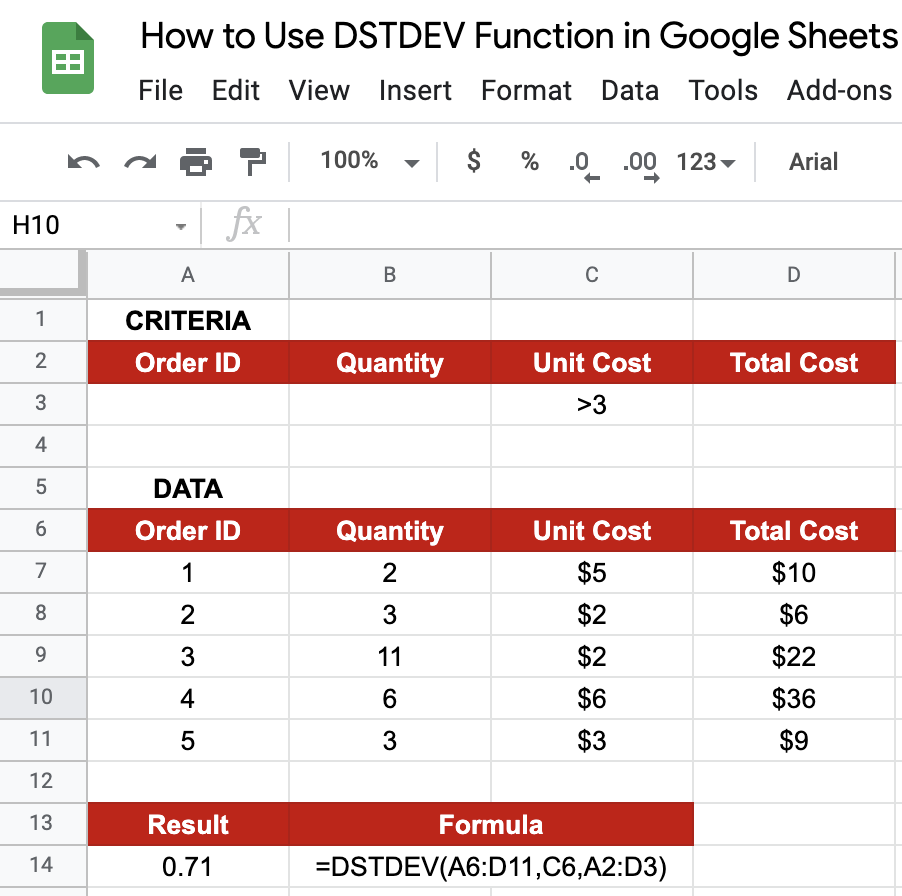
What does the 0.71 value mean here? The two orders which have a unit cost of more than $3 listed here are Order IDs 1 and 5, costing $5 and $6 respectively. The formula gives a standard deviation of 0.5, which means the values ($5 and $6) are not too different from the mean value ($5.5). This indicates that all the purchases Linda made for more than $3 are for about the same value, since the dispersion is not that high.
Why is this value higher compared to the standard deviation obtained from the DSTDEVP function, though?
When we calculate standard deviation based on the entire population, the denominator of the formula is the total number of items. However, when the standard deviation is calculated from a sample data, we subtract a value of 1 before dividing the sum of the squared deviations. For this very reason, the value of standard deviation calculated from sample data is higher than the value that could have been found out by using population data. The logic of doing so is to compensate for our lack of information about population data. When sample data is taken for most statistical purposes, it is accompanied by a lack of information about the majority of data. In order to compensate for this, the value of standard deviation is higher in the case of sample data than standard deviation from population data.
You may try changing the criteria and see how the result changes. Go ahead and make a copy of the spreadsheet using the link I have attached below:
Awesome! Let’s begin our DSTDEV function in Google Sheets.
How to Use DSTDEV Function in Google Sheets
- Let’s see how to write your own
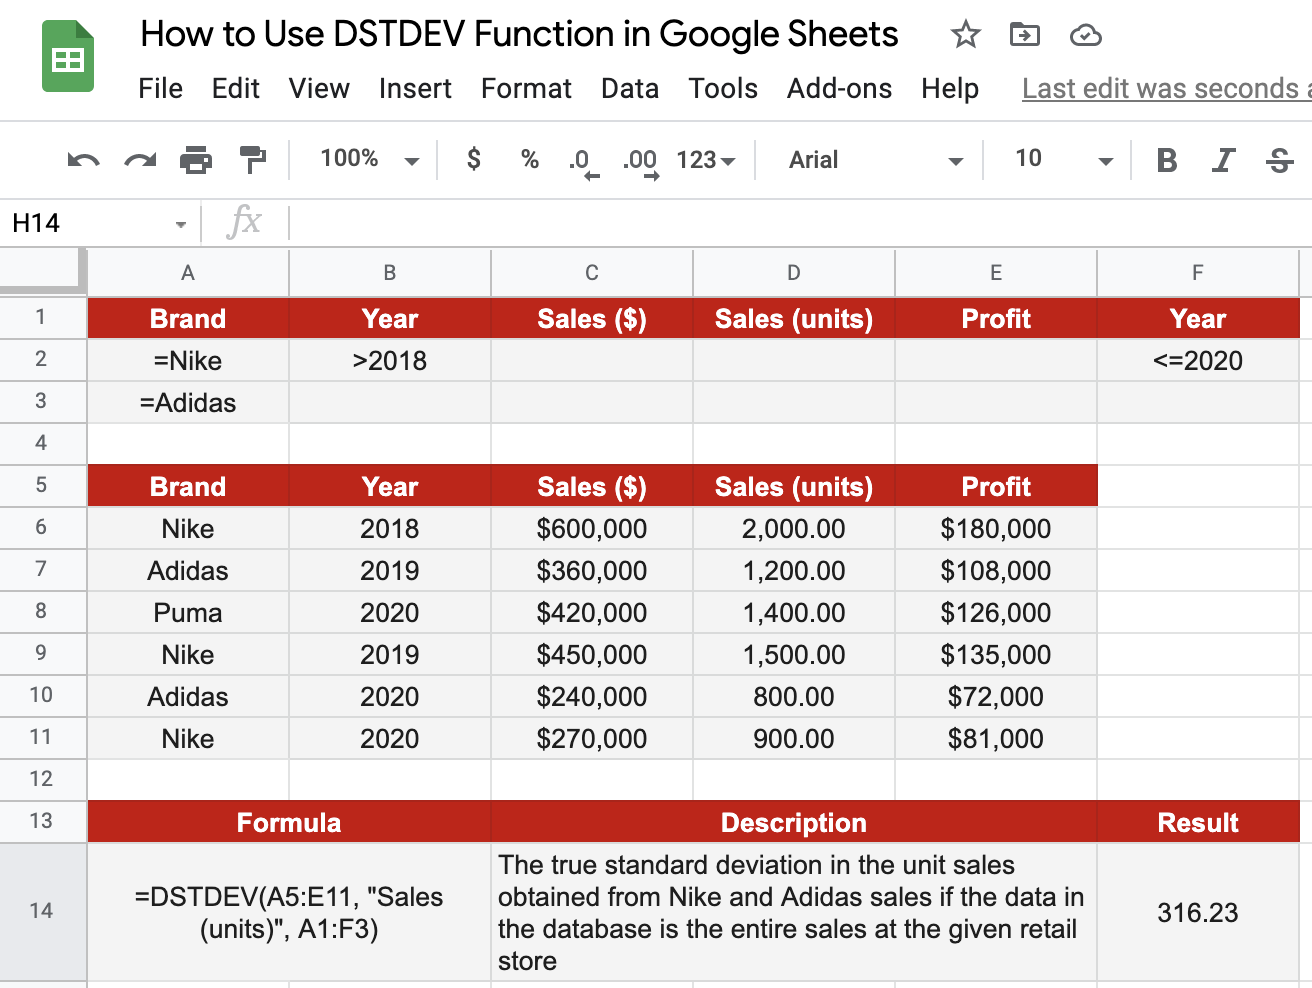
DSTDEVfunction, step-by-step. First of all, I have pasted sales data from a single retail store across three years, from 2018 to 2020, for three apparel brands – Nike, Adidas, and Puma.

- Now, simply click on any cell to make it the active cell. For this guide, I will be selecting F14, where I want to show my results.
- Next, simply type the equal sign ‘=‘ to begin the function and then followed by the name of the function, which is our ‘dstdev‘ (or DSTDEV, whichever works).
- You should find that the auto-suggest box appears with our function of interest. Continue by entering the first opening bracket ‘(‘. If you get a huge box with text in it, simply hit the arrow in the top-right hand corner of the box to minimize it. You should now see it as follows:

- Now, the fun begins! Let’s give the required inputs to the function to get the standard deviation in unit sales, per the filtration criteria we have given above the data:

- Take note of how I’ve specified conditions to limit the data to the Nike brand (selecting only the years 2019 and 2020). The criteria for the formula are input as A1:F3 to account for all the criteria mentioned, if any.
- Once you’ve entered the necessary database, field, and criterion values, or you’ve done what I did, make sure to close the brackets ‘)’, as shown below.

- Finally, just hit your Enter key. If you followed my instructions, you should have gotten 316.23 as the function’s output, which is nothing but the standard deviation of Nike and Puma combined unit sales (for the criteria specified above the data table).
As explained in the previous example, note that the standard deviation is higher here since we are considering the data to be a sample, and not the entire population.
As per the specified criteria, the sales units that qualify to be considered vary from 800 units to 1,500 units with an average value of 1,100 units. The standard deviation obtained denotes that the data points aren’t that close to each other.
That’s pretty much it. You have everything you need to get started with the DSTDEV function on Google Sheets. I recommend experimenting with the DSTDEV function, combining it with the numerous Google Sheets formulas available, and seeing what you can come up with. 🙂