


This guide will explain how to find missing data in your Excel dataset using the pandas library.
Table of Contents
Python’s pandas library is one of the most popular tools for data analytics. One of its major features is the ability to load data into DataFrame objects that can accommodate a variety of data types.
Pandas come with functions specifically for handling missing values that can detect, remove, and even replace missing values in your dataset.
The newly launched Python in Excel feature will allow you to run a pandas workflow within Microsoft Excel.
In this guide, we will provide a step-by-step tutorial on how to use Python in Excel to find missing data in your dataset.
The Anatomy of the PY Function
The syntax of the PY function is as follows:
=PY(python_code,return_type)
Let’s look at each argument to understand how to use the PY function.
- PY() refers to our
PYfunction. This function allows us to run Python code on a secure Microsoft Cloud runtime. - python_code refers to the Python code you wish to run. This value must be static text.
- The return_type parameter allows us to specify the desired return type. A value of 0 indicates an Excel value, while a value of 1 indicates a Python object.
- Do note that the
PYfunction cannot be used with any other Excel functions.
A Real Example of Finding Missing Data in Excel Using Pandas
Let’s explore a simple example where we can use the pandas library to find and handle missing data in an Excel dataset. We’ll use pandas to determine the extent of missing data in a sample dataset of heights and weights.
Identifying Our Missing Values

In the table above, we have a sample dataset with heights and weights of 25,000 respondents. We want to determine how many rows in our dataset contain missing data.
We can use Python code to determine the number of missing data points. We’ll first use Python’s pandas library to load our Excel data into a DataFrame object using the following formula:
=PY("df =xl(""A1:C25001"", headers=True)",1)
After loading our dataset into a pandas DataFrame, we can use other pandas functions to identify the status of our missing data.

For example, we can use the following function to show the number of null values in each column:
=PY("df.isnull().sum()",1)

The formula returns a Series object that indicates how many missing values are in each column. In this example, we find out that there are 21 missing values in the Height column and 20 missing values in the Weight column.
We can also use the following formula to return a DataFrame containing just the rows with missing values:
=PY("df[df.isnull().any(axis=1)]",1)
The output of the PY function will be a DataFrame containing every row in our dataset with missing data.

In our example above, we can see that each row in our output contains at least one instance of the #NUM! Error, which is the equivalent error for Python’s null value.
Dropping Rows with Missing Values
Since rows with missing values could affect the accuracy of our analysis, some opt to perform their analysis on a dataset excluding these problematic rows. To drop all rows with missing values, we can use the pandas function dropna().
We can use the following Python code to create a new DataFrame from the result of the dropna() function:
clean_df = df.dropna()
clean_df

After executing the Python code, you should now be able to use the clean dataset without any rows with missing values.
Click on the link below to create your own copy of our examples.
Head to the next section to read our step-by-step tutorial on how to find missing data using pandas.
How to Find Missing Data Using Pandas in Excel
- Select a blank cell and type the keyboard shortcut Ctrl+Alt+Shift+P to convert the Excel formula bar into a Python code editor. You may also type the function “=PY(“ to enter the editor.

- You may also add a new Python code to a cell by selecting Formulas > Insert Python.

- Next, we’ll need to load our data into a DataFrame object.
 In our example above, we used the code =PY(“df =xl(“”A1:C25001″”, headers=True)”,1).
 - We can use the isnull() and sum() functions together on our df variable to find the number of missing values in each column.
 Type df.isnull().sum() and hit Ctrl+Enter to execute the line of Python code.
 - You can click on the card icon to see the actual values from our Series object.
- We can use the Python code df.isnull().any(axis = 1).sum() to find the total number of rows in our dataset that have missing values.

- To return a DataFrame with all the rows with missing data, we can use the Python code df[df.isnull().any(axis=1)].
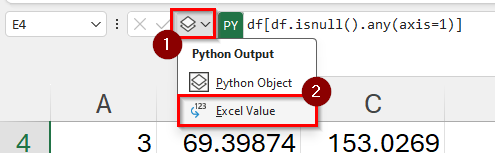 Set the Python Output to an Excel Value by clicking on the icon to the left of the Python editor.
This will reveal the entire DataFrame as a cell range on your spreadsheet.
FAQs
- How can you replace all missing values in a DataFrame with a specific value?
You can use the fillna() method in pandas to replace missing values with a predetermined value. For instance, df.fillna(0) will replace all missing values in DataFrame df with 0. Another method of handling missing values is replacing the null value with the mean of the column. To do this, we can use the code df.fillna(df.mean()). - Can the dropna() method permanently remove missing data from the original DataFrame?
By default, dropna() returns a new DataFrame and does not modify the original. To permanently remove missing data from the original DataFrame, you need to use the inplace=True parameter. For example, the code df.dropna(inplace=True) will permanently modify the original df object.
To learn more about using Python in Excel, you can read our post on how to use the scikit-learn library in Excel. You may also be interested in our guide for how to use ChatGPT for data analysis in Excel.
That’s all for this guide! Be sure to check out our library of spreadsheet resources, tips, and tricks!


