This guide will discuss how to get descriptive statistics in Excel using the data analysis tool.
Excel makes a lot of statistical tasks easier and faster with several of its built-IN tools and functions. And one of these is the ability to perform descriptive statistics.
So descriptive statistics refers to describing the data set’s characteristics and summarizing your data. And Excel makes this entire process easier and more efficient with the use of its data analysis tool.
Let’s take a sample scenario.
Suppose you are using Excel to input your research data. And you decided to focus on getting the descriptive statistics of your data. But, performing it manually and individually would take up too much time. So you opted to utilize the tools available in Excel to get the descriptive statistics in Excel.
Awesome! Let’s dive into a real example of getting descriptive statistics in Excel.
A Real Example of Getting Descriptive Statistics in Excel
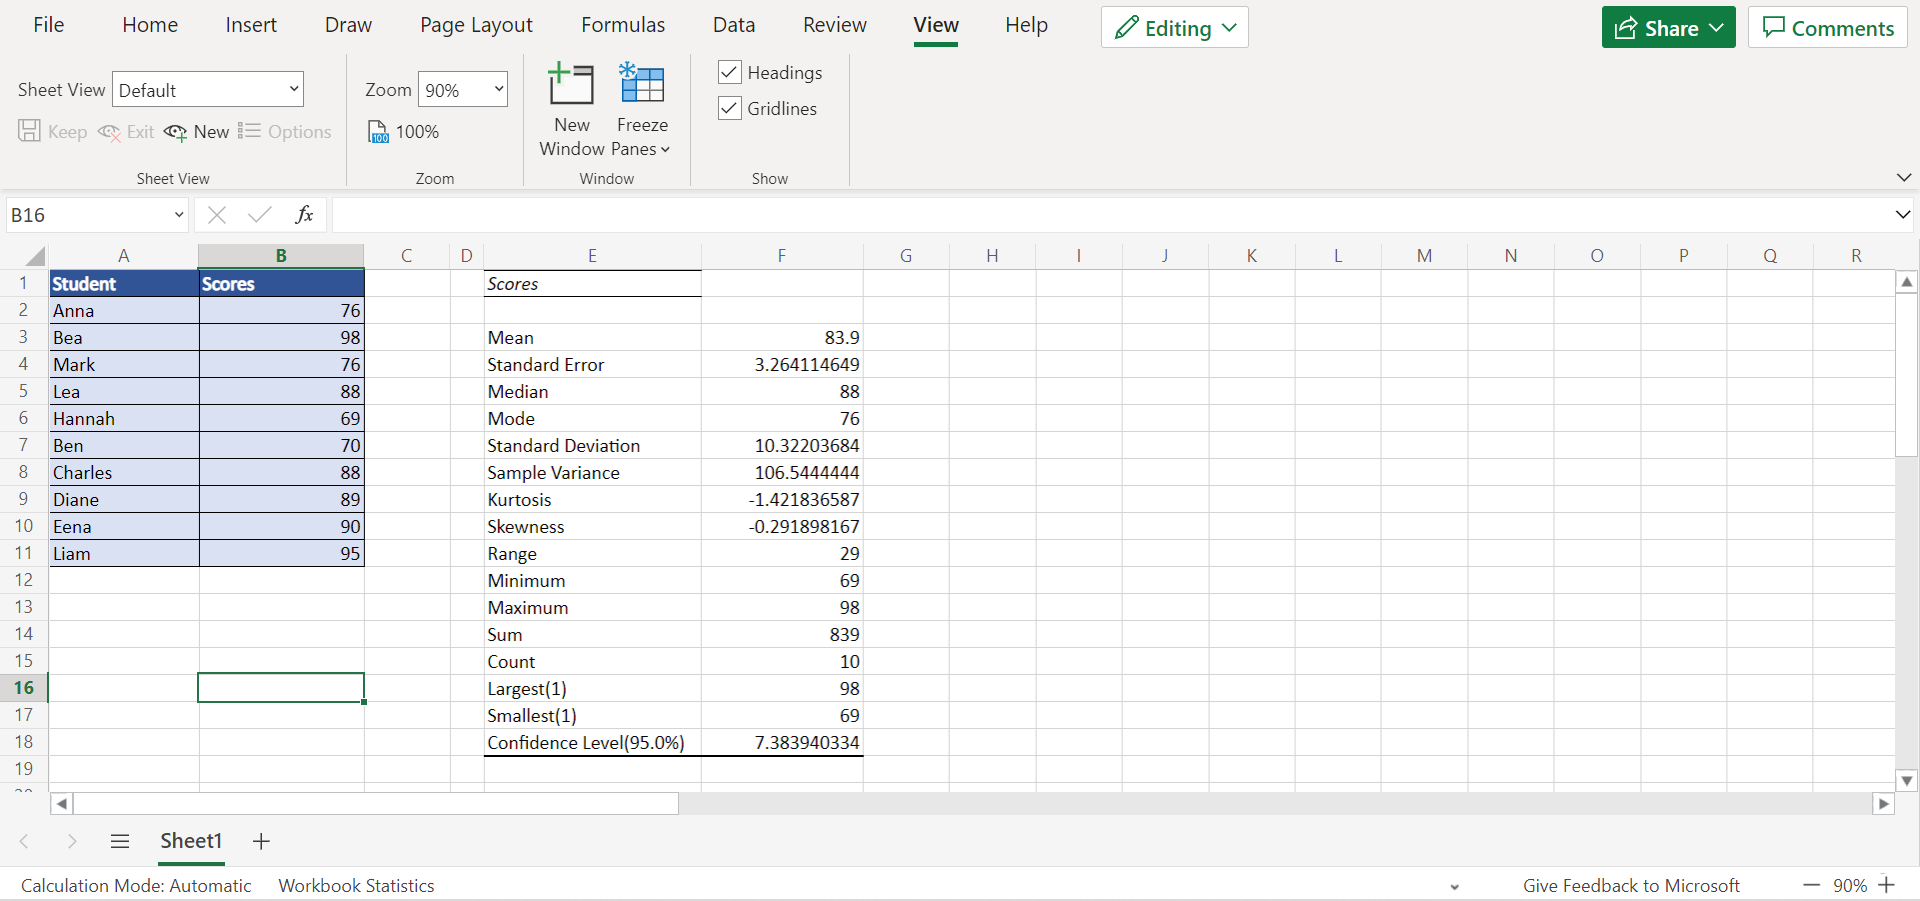
Let’s say we have a data set containing students’ test scores in a class. So our initial data set would look like this:

And we want to obtain the descriptive statistics of this data set. To do this, we can simply utilize the data analysis tool available in Excel.
So the data analysis would calculate the mean, standard error, median, mode, standard deviation, sample variance, and more descriptive statistics value for us. Instead of calculating all of them one by one, this method will quickly supply us with the results we need for our data set.
Furthermore, the data analysis tools have several options we can choose from to customize our descriptive statistics. Firstly, we can choose where to display the statistics, whether in a specific range, another worksheet, or even a completely new workbook.
Secondly, we can choose how to organize the variables. Thirdly, we can also choose the type of descriptive statistics we want to include in our results. Lastly, we can input the specific values for our confidence level for the mean and the kth.
Finally, we will get the descriptive statistics of our data set in Excel.
You can make your own copy of the spreadsheet above using the link attached below.
Awesome! Now let’s move on and discuss the step-by-step process of how to get descriptive statistics in Excel.
How to Get Descriptive Statistics in Excel
In this section, we will learn the steps of how to get descriptive statistics in Excel using the data analysis tool. Each step contains detailed instructions and pictures to guide us along the process.
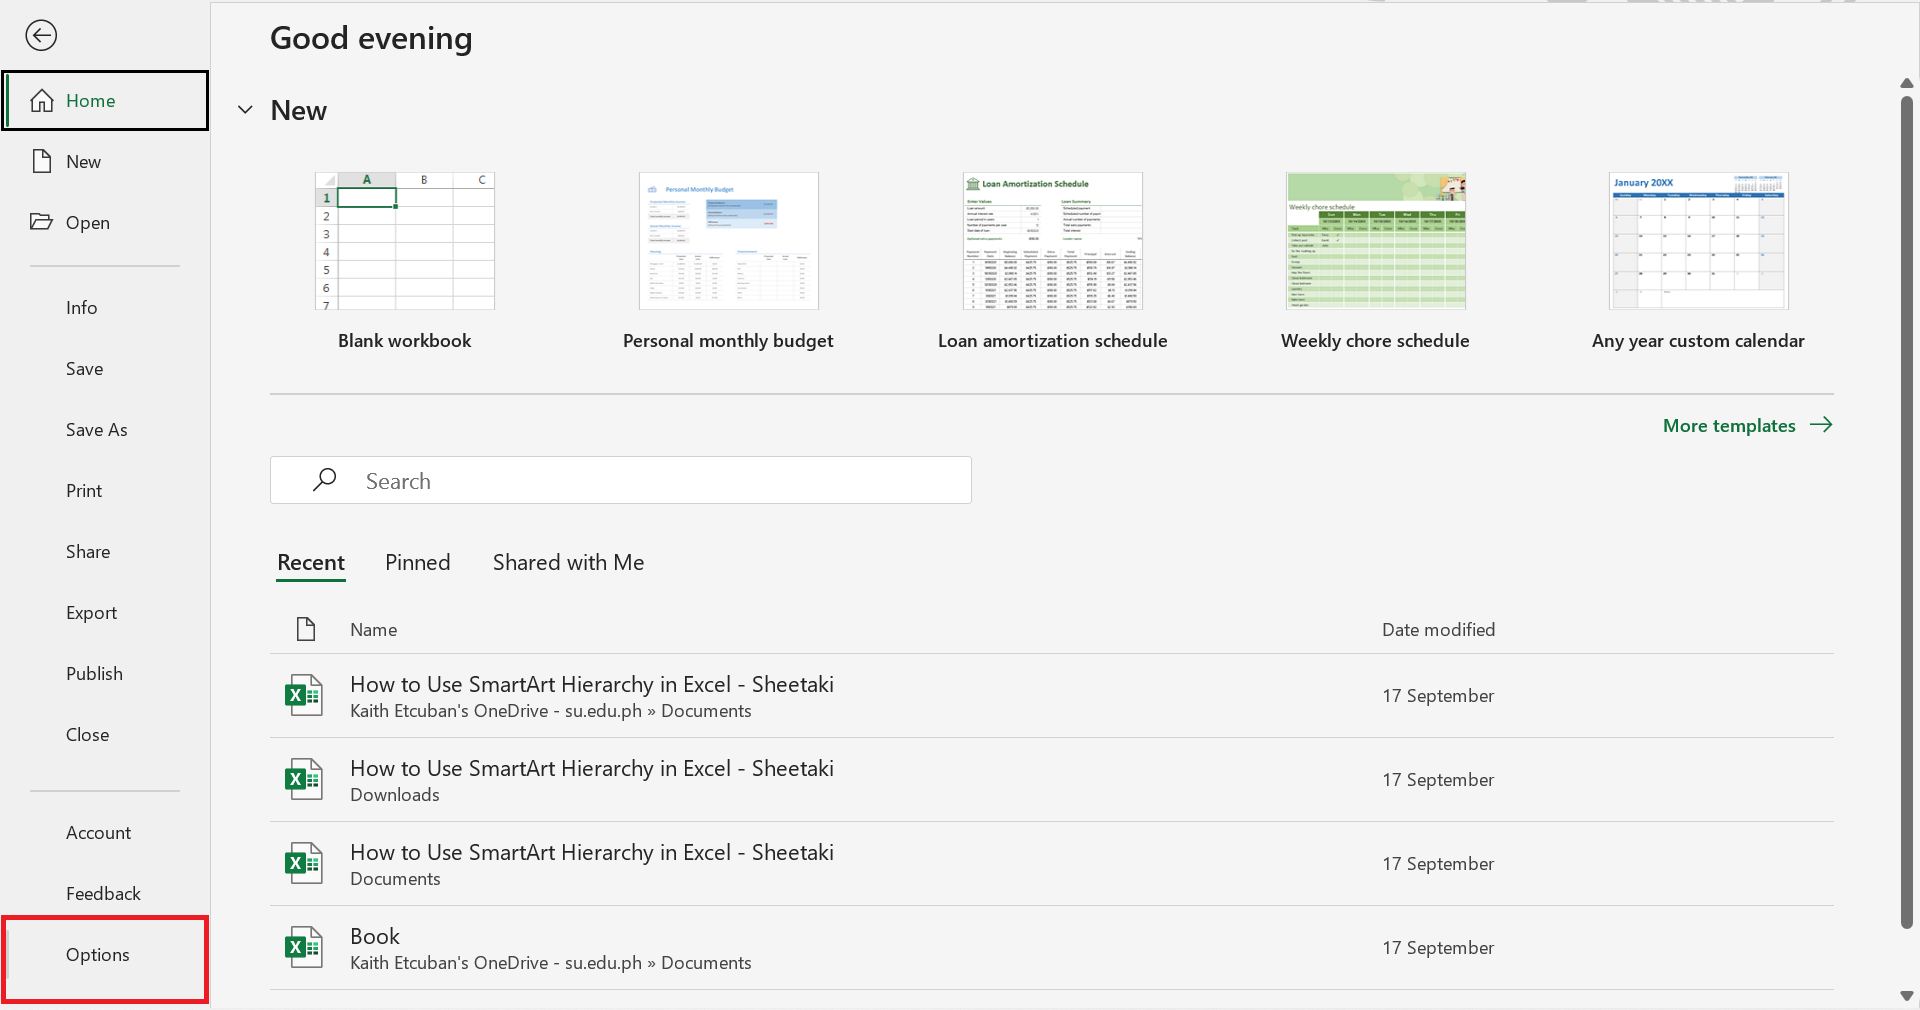
1. Firstly, we need to add the Data Analysis tool because sometimes it may not be available in our ribbon. To add the Data Analysis tool, go to the File tab and select Options.
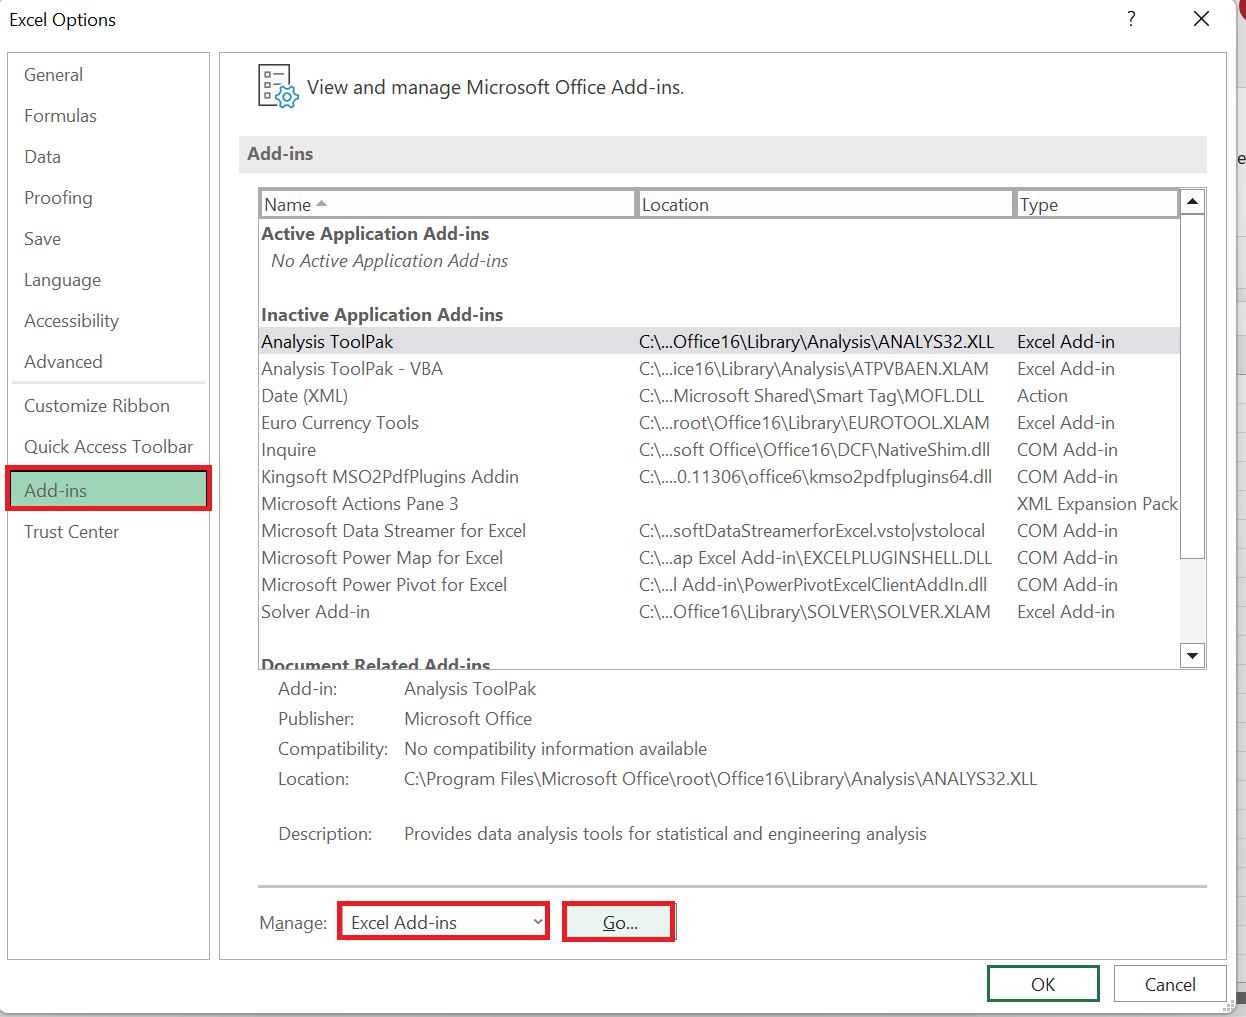
2. Secondly, go to the Add-ins section. Under Manage, select Excel Add-ins in the dropdown menu. Lastly, click Go.
3. Thirdly, check Analysis ToolPak in the menu. Then, click OK to add the Data Analysis tool. And tada! We finally have Data Analysis available in our ribbon.

4. Next, go to the Data tab. Then, click Data Analysis.

5. So the Data Analysis window will open. Afterward, click on Descriptive Statistics under the Analysis Tools menu. Lastly, click OK to apply.

6. And the Descriptive Statistics window will appear. In this window, type the range containing the data set in the Input Range space. Also, check the Labels in first-row option if the data set has headers.
Furthermore, go to the Output options section. In this section, select where you want the results to appear. In this case, let’s choose another range in the same worksheet. Lastly, select Columns in the Grouped By option.
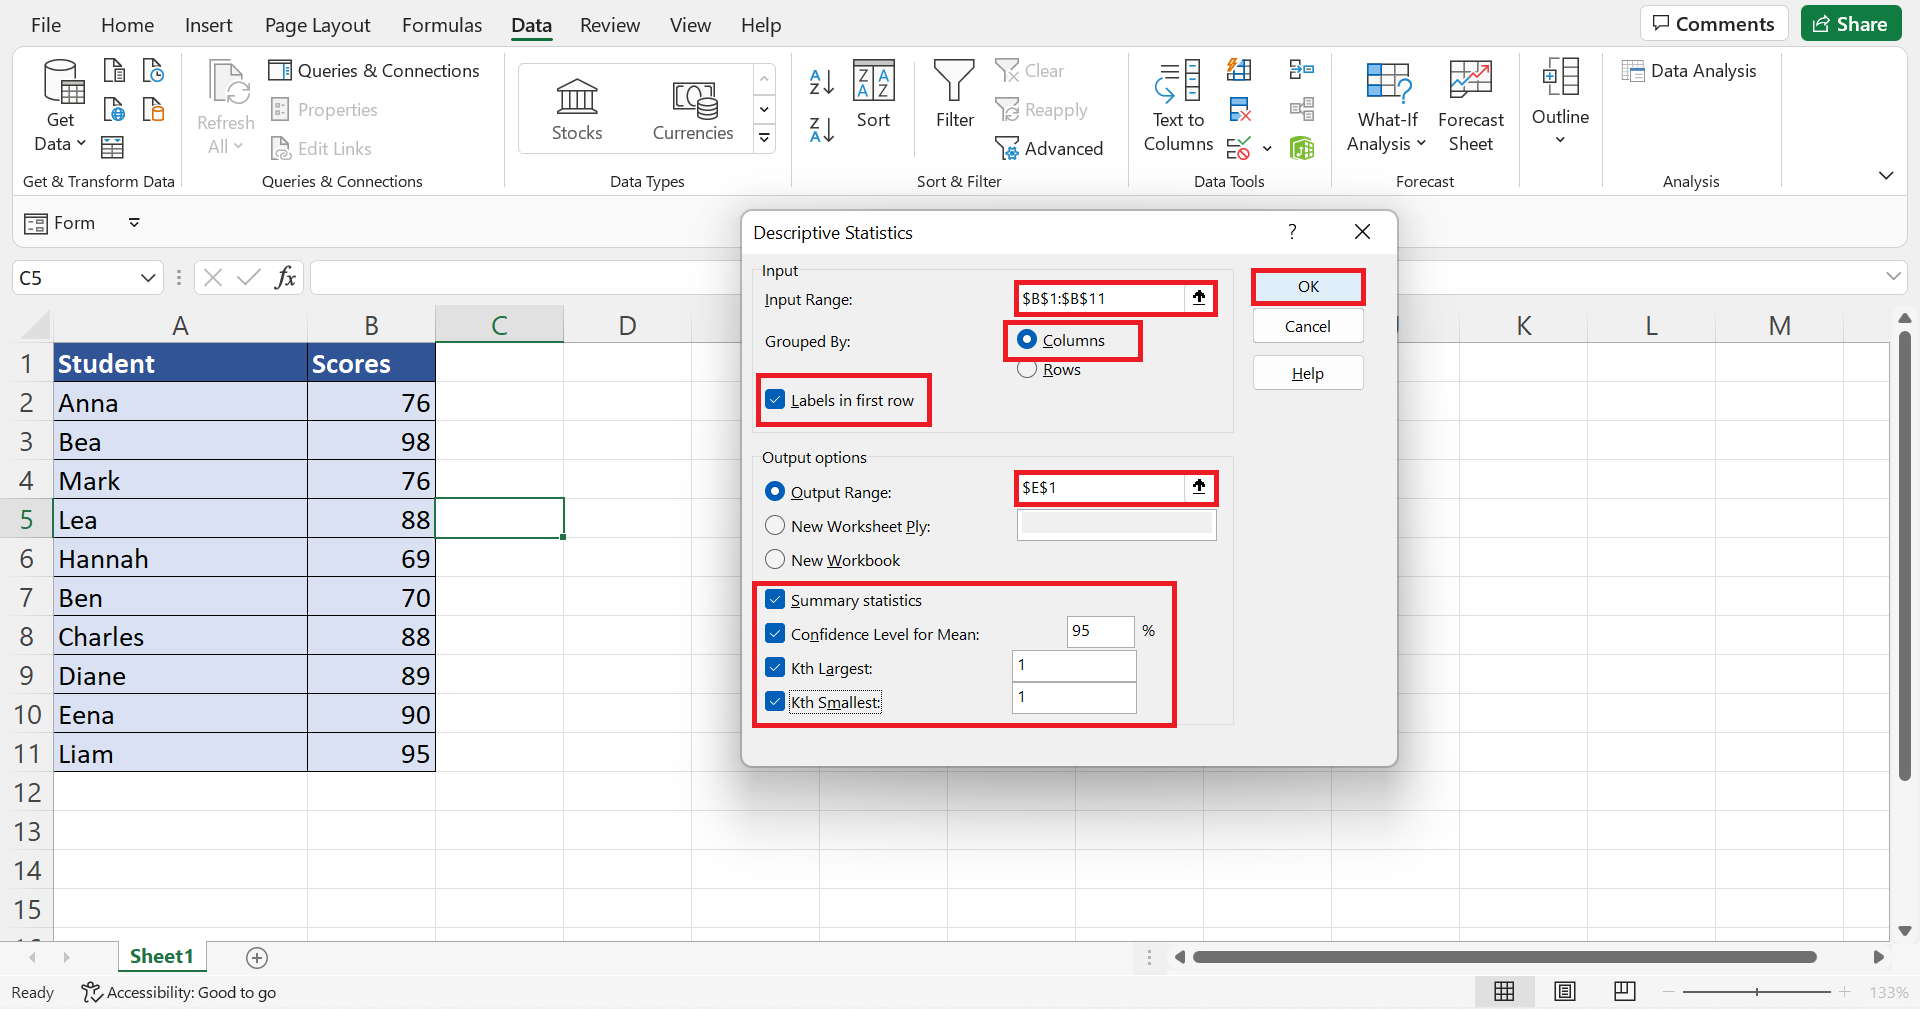
7. Afterward, we must select the statistics options or values we want to include. In this case, let’s check all the boxes and input the necessary values. Finally, click OK to apply the changes.
8. And tada! We have successfully gotten the descriptive statistics in Excel.
That’s pretty much it! Wasn’t it quite simple and fast? We have explained how to get descriptive statistics in Excel using the data analysis tool. Now you can apply this learning whenever you need to obtain the descriptive statistics of a data set, but you want to get it easily and quickly.
Are you interested in learning more about what Excel can do? You can now use the various other Microsoft Excel formulas available to create great worksheets that work for you. Make sure to subscribe to our newsletter to be the first to know about the latest guides and tutorials from us.