This guide will explain how to calculate the variance inflation factor or VIF in Excel.
The variance inflation factor determines the presence of multicollinearity in a regression model.
Multicollinearity is when two or more variables in a dataset are strongly correlated.
Many strongly correlated variables may be a problem for regression models since it makes it difficult to determine the statistical significance of the independent variable in a regression model.
We can calculate the VIF of each variable to determine if the model is affected by multicollinearity.
The equation for calculating VIF is as follows:
=1/(1-R^2)
The R^2 or R-squared value is a statistic that determines the relationship between the model and each of the independent variables.
We can use the RSQ function to find the R-squared value of each independent variable. After finding the R-squared values, we can proceed to use the VIF formula described earlier to determine whether multicollinearity is an issue.
When do we need to find the VIF? Suppose you have a regression model that includes three independent variables. We can calculate the VIF of each of these variables to see if any two variables correlate.
We can remove one of these correlating variables to create a more efficient regression model.
Now that we know when to calculate the VIF in Excel, let’s learn how to use it and work on an actual sample spreadsheet.
A Real Example of Calculating VIF in Excel
The following section provides several examples of how to calculate the variance inflation factor in Excel. We will also explain the formulas and tools used in these examples.
First, let’s take a look at our sample data.
We have a dependent variable in column B. Our regression model relies on three additional independent variables: X1, X2, and X3.

We want to know if the regression model experiences multicollinearity. We’ll calculate the VIF of each variable to determine whether we should be removing any of our independent variables.

Do you want to take a closer look at our examples? You can make your own copy of the spreadsheet above using the link attached below.
Use our sample spreadsheet to test out how we calculated the r-squared values and VIF of each variable.
If you’re ready to try calculating VIF in Excel, head over to the next section to read our step-by-step breakdown on how to do it!
How to Calculate VIF in Excel
This section will guide you through each step needed to calculate the VIF in Excel. You’ll learn how ???
Follow these steps to start calculating the variance inflation factor in Excel:
- First, create a new table for calculating each variable’s R-squared value and VIF.

- We can compute the R-squared value by using the RSQ function. Type ‘=RSQ(‘ into the formula bar and add the dependent variable range as the first argument.

- We’ll add the range of the current independent variable as the second argument of
RSQ.

- Hit the Enter key to return the r-squared value.
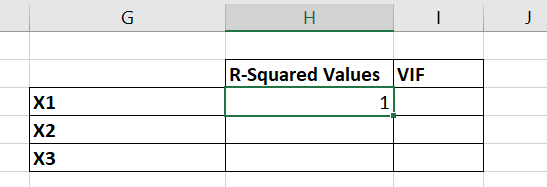
- Use the Fill Handle tool to find the R-squared values of the other variables.

- Next, we’ll calculate the variance inflation factor using each variable’s r-squared value. We can find the VIF using the formula
=1/(1-H3).

- Use the Fill Handle tool to find the VIF of the remaining variables. A value of 1 indicates there is no correlation found. A value greater than 5 could indicate a major correlation between two variables.
These are all the steps needed to calculate the variance inflation factor in Excel.
Frequently Asked Questions (FAQ)
Here are some frequently asked questions about finding the variance inflation factor:
- Why is multicollinearity an issue with regression models?
A regression model with high multicollinearity can make your model sensitive to small changes. The regression model’s results may also be less reliable because of a larger standard error. It is always better to use independent variables that are not correlated with each other. - How do I eliminate multicollinearity from my dataset?
The simplest way to eliminate multicollinearity is to identify variables that correlate and remove all but one field from your dataset. You may also choose to combine two or more collinear variables into a single variable.
This step-by-step guide should provide you with all the information you need to calculate VIF in Excel.
You should now have a clearer idea of multicollinearity and how it may affect your regression model. We’ve shown how you can use the Excel function to find the variance inflation factor for each independent variable in your regression model.
Calculating the VIF is just one example of the many statistical methods you can perform in your spreadsheets. Our website offers hundreds of other functions and methods to help you get more out of Microsoft Excel.
With so many other Excel functions available, you can find one appropriate for your use case.
Don’t miss out on our team’s new spreadsheet tips, tricks, and best practices. Subscribe to our newsletter to stay updated on the latest guides from us!